Blog · Bay Area · League table · August 19, 2026
The Bay Area's next ten — and why rank is the wrong way to read them
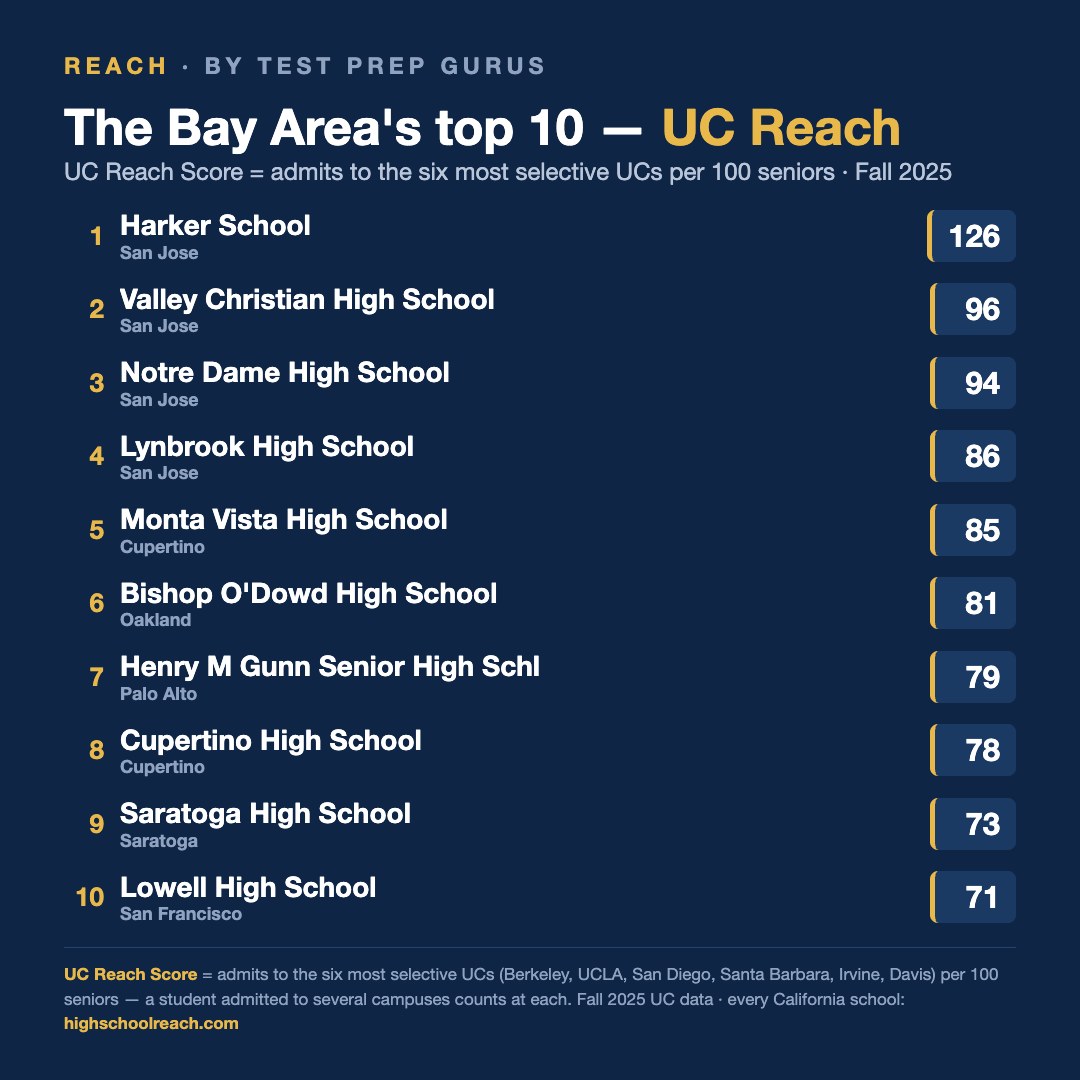
We published the Bay Area's top 10 for UC admits last week. It travelled further than anything we've posted, and nearly every comment underneath asked the same question in slightly different words: where's my school?
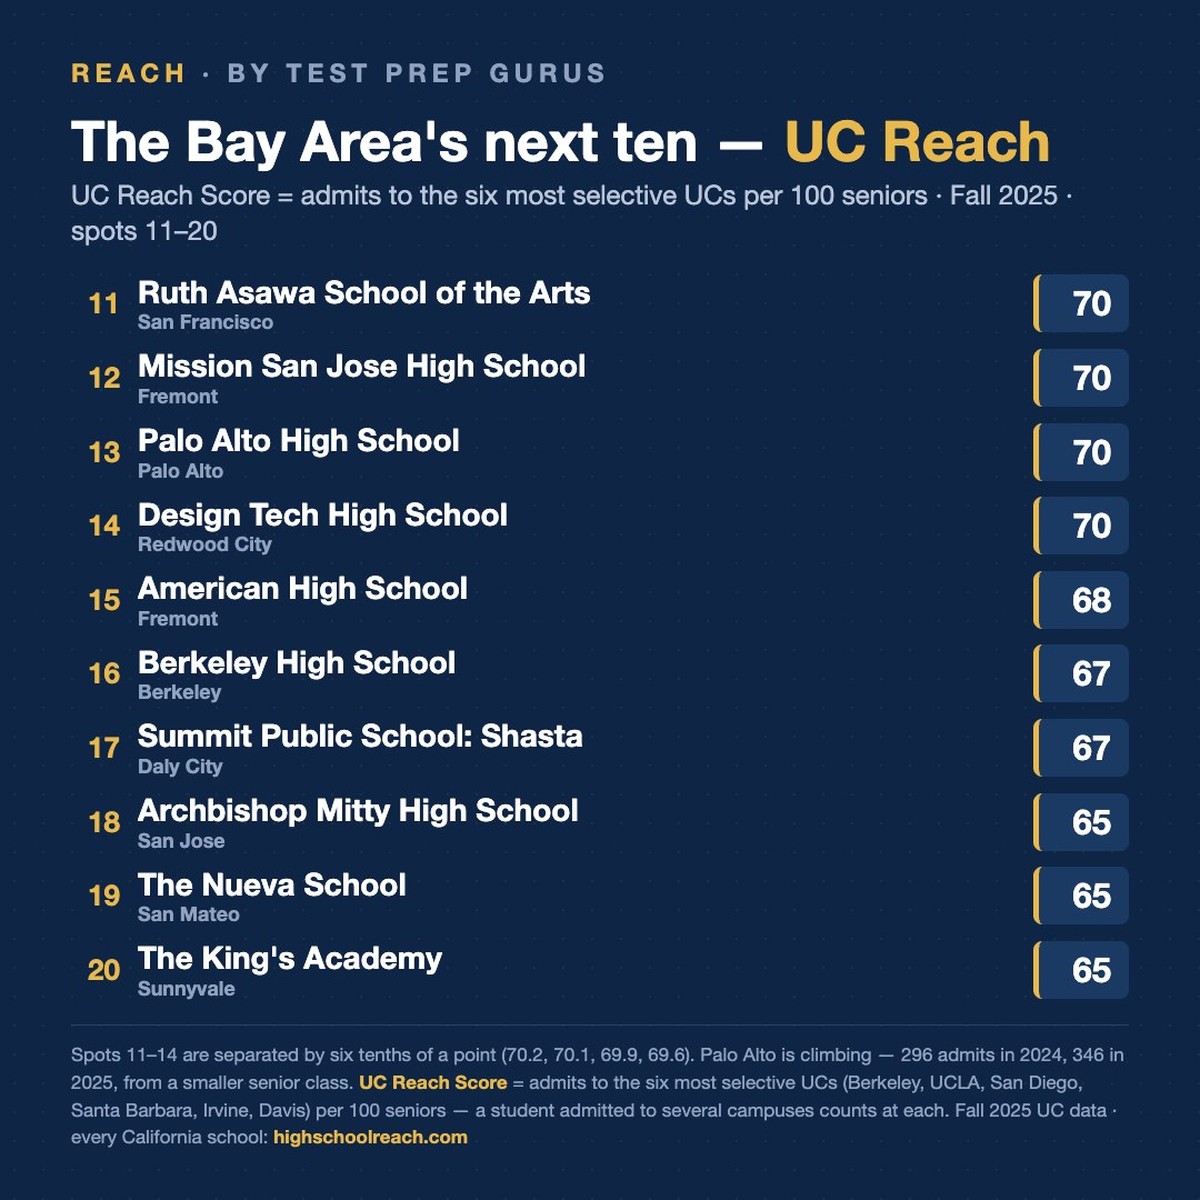
Fair question. Here are spots 11 through 20 for Fall 2025: Ruth Asawa School of the Arts (San Francisco) 70, Mission San Jose High School (Fremont) 70, Palo Alto High School 70, Design Tech High School (Redwood City) 70, American High School (Fremont) 68, Berkeley High School 67, Summit Public School: Shasta (Daly City) 67, Archbishop Mitty High School (San Jose) 65, The Nueva School (San Mateo) 65, The King's Academy (Sunnyvale) 65.
Look at the top four, because they say something a ranked list is bad at saying. Ruth Asawa scored 70.2. Mission San Jose 70.1. Palo Alto 69.9. Design Tech 69.6. Four schools, six tenths of a point between first and last. Printed as ranks that reads like four different results. It isn't — those four produced the same outcome, and which one lands at 11 and which at 14 is a rounding decision.
That matters because of how families read lists. A parent sees 14th and hears "worse than 11th." The data doesn't support the sentence.
The other result worth pulling out is Palo Alto High School. Its graduates earned 296 admits to the six most selective UC campuses in 2024 and 346 in 2025 — from a senior class that got smaller, not bigger. That is not a school that just missed the top 10. That is a school climbing into it.
The UC Reach Score is admits to Berkeley, UCLA, San Diego, Santa Barbara, Irvine and Davis per 100 seniors, from Fall 2025 UC data; a student admitted to three campuses counts three times. The full definition is on our methodology page.
As always, this measures one outcome. Berkeley High is on this list with a senior class of 799, which is a different problem from producing the same rate with 108 students at Nueva. Both are real, and neither number tells you what it is like to be a student there.
We're publishing all 58 California counties — Orange County went up this week, and the statewide rankings hold every school we cover. Every school on this list has its own page with an eight-year trend and campus-by-campus detail.
If you want this turned into a plan for your own student, start with the Family Decision Report. Test Prep Gurus publishes a companion version of this post on its blog.