San Diego Academy
National City · San Diego County · Religious-affiliated
Compare with peers
Most similar nearby schools
Cristo Rey San Diego High School → Calvary Christian Academy → Foothills Christian High School → Victory Christian Academy → Waldorf School of San Diego High School → Compare all similar →Keep this page current
Work at San Diego Academy? If this page is missing your newest school profile, matriculation list, or college acceptances, send us the links. We read the document, copy the figures exactly as published, and cite it on this page.
Send us links
Links only, please. We can't take file uploads, and we never publish a number without the document it came from.
How San Diego Academy compares for families
What families should know about San Diego Academy.
- ▸ vs Similar SchoolsThe closest comparables nearby: Cristo Rey San Diego High School, Calvary Christian Academy, Foothills Christian High School and 2 more. See the sidebar to compare side-by-side.
For Parents
Get alerts when San Diego Academy's numbers change
New admissions results, enrollment shifts, test scores — a few alerts a year, no spam. Your email also saves your list across devices.
Objective, government-grade data — no school pays us for placement.
No SBAC data for private schools — and that's not the metric you want anyway
California's Smarter Balanced (CAASPP) assessment is administered by the state, by statute, to public & charter schools only. Private schools don't sit for it. That's why the SBAC card is missing on this profile — not a data gap on our side, a deliberate scope of the state's testing program.
For private schools, UC Reach is the stronger academic signal anyway. SBAC measures grade-11 inputs (proficiency on a state standard); UC Reach measures outputs (who actually got into the most selective UCs). For private-school families weighing tuition against college outcomes, the outputs are the relevant signal.
This school doesn't have UC outcomes data on file yet — we surface UCOP-published admits by sending HS, and not every private school appears in those records. The enrollment trend, stability, and other cards on this page are still primary-sourced for this school.
Enrollment trend & projection
If this trend holds (-5.4%/yr, Total enrollment)
At tuition of $ / student:
| Horizon | Projected Total enrollment | Change | Tuition impact / yr |
|---|---|---|---|
| 1 yr (2026) | ~179 | -10 | $0 |
| 3 yr (2028) | ~160 | -29 | $0 |
| 5 yr (2030) | ~143 | -46 | $0 |
Straight-line extrapolation of the recent annual rate — a what-if, not a forecast of intent. Default = a wide range — Jewish day $25k–35k, Lutheran/Christian $10k–18k. Edit the figure to match your school.
How does San Diego Academy really compare on getting kids to college?
Unlock a head-to-head snapshot of San Diego Academy against its 10 most similar nearby schools — matched on size, location, type, and religious orientation. See exactly where it stands on the college pipeline.
Your similar-school group includes
Cristo Rey San Diego High School · Calvary Christian Academy · Foothills Christian High School · Victory Christian Academy · Waldorf School of San Diego High School · Ocean View Christian Academy · +4 more
Private-school figures come from the California Private School Affidavit. Per CDE, inclusion in private-school data is not an evaluation, approval, or endorsement of a school.
UC Outcomes Trend — 2021–2023
Class size from CDE grade 12 enrollment. Campus-level data: applicant and admit totals count a student once at EACH campus. A senior admitted to UCLA and UC San Diego adds 2 to the admit total, so the total can exceed the senior class — that is the metric working as defined, not an error. The admit RATE is unaffected: both its numerator and denominator are campus-level.
Campus Breakdown — 2023
| Campus | Applicants | Admits | Enrollees | Admit Rate | UC Reach Score | Yield | Avg GPA (App) | Avg GPA (Adm) |
|---|---|---|---|---|---|---|---|---|
| UC San Diego → Selective | 6 | —† | —† | —† | —† | — | 3.94 | —† |
| UC Irvine → Selective | 5 | —† | —† | —† | —† | — | 3.90 | —† |
What This Means
At a glance
JSON · Using this page with an AI assistantSan Diego Academy is a private high school in National City, San Diego County, California.
Enrollment was 189 students in 2025, down 27% since 2020.
Sources: University of California Office of the President (admissions), California Department of Education (enrollment, A-G, college-going), and the school's own published documents where named.
Questions families ask
How many students attend San Diego Academy? Enrollment was 189 students in 2025, down 27% since 2020.
Analysis: Test Prep Gurus (High School Reach, highschoolreach.com). These figures may be quoted with attribution to Test Prep Gurus.
Related reading
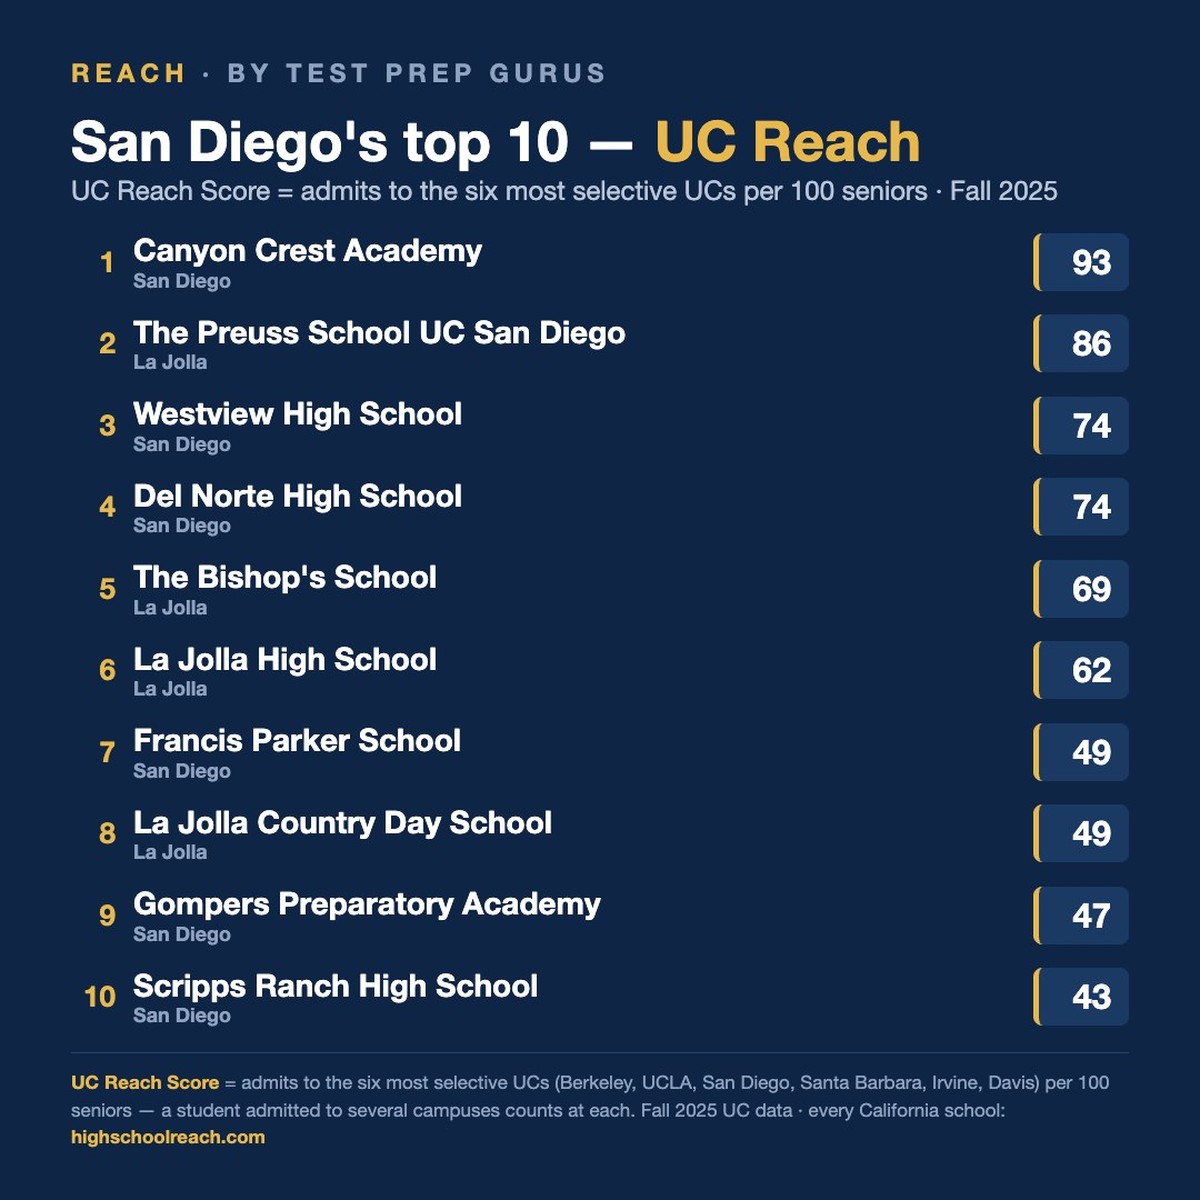
San Diego · League table · August 9, 2026
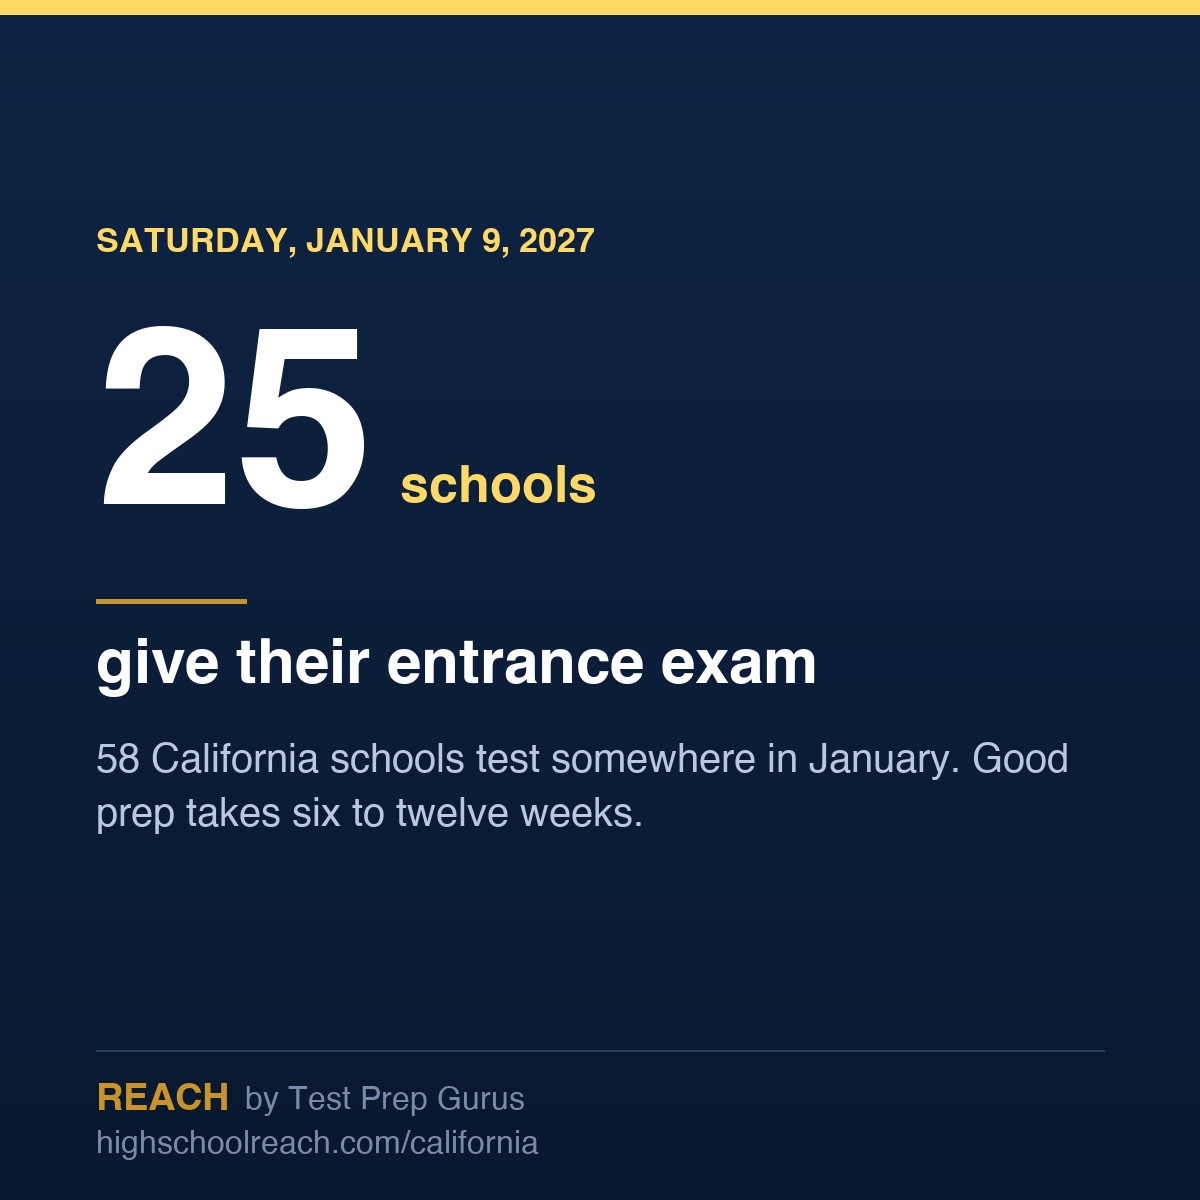
California · October 2, 2026
California counties · October 2026