Similar nearby schools
Most similar nearby schools
John F. Kennedy High → Circle of Independent Learning → Young Adult Program → Irvington High → Newark Memorial High → Robertson High (Continuation) → Washington High → California School for the Deaf-Fremont →How Mission Valley ROCP compares for families
What families should know about Mission Valley ROCP.
- ▸ LocallyCA trails the US average on NAEP 8th-grade math (−4 points). Stronger local schools matter even more.
- ▸ vs Similar SchoolsThe closest comparables nearby: John F. Kennedy High, Circle of Independent Learning, Young Adult Program and 5 more. See the sidebar to compare side-by-side.
For Parents
Get alerts when Mission Valley ROCP's numbers change
New admissions results, enrollment shifts, test scores — a few alerts a year, no spam. Your email also saves your list across devices.
Objective, government-grade data — no school pays us for placement.
Not enough enrollment history on file to chart a trend for this school yet.
Most similar nearby high schools
The schools most like this one — same type, blended on distance and size — and where their enrollment is heading. These are the schools families here weigh against each other.
| School | Type | Miles | HS enrollment | Trend |
|---|---|---|---|---|
| John F. Kennedy High Fremont |
Public | 0.1 | 1,273 | -3.1% |
| Circle of Independent Learning Fremont |
Public · charter | 0.8 | 214 | -0.5% |
| Young Adult Program Fremont |
Public | 0.8 | 48 | — |
| Irvington High Fremont |
Public | 1.0 | 2,157 | -6.8% |
| Newark Memorial High Newark |
Public | 1.1 | 1,367 | -16.3% |
| Robertson High (Continuation) Fremont |
Public | 1.2 | 169 | +9.0% |
| Washington High Fremont |
Public | 1.8 | 1,957 | +0.9% |
| California School for the Deaf-Fremont Fremont |
Public | 2.5 | 159 | -14.1% |
Related reading

The data Newsom asked for already exists — school by school
UC testing review · August 25, 2026
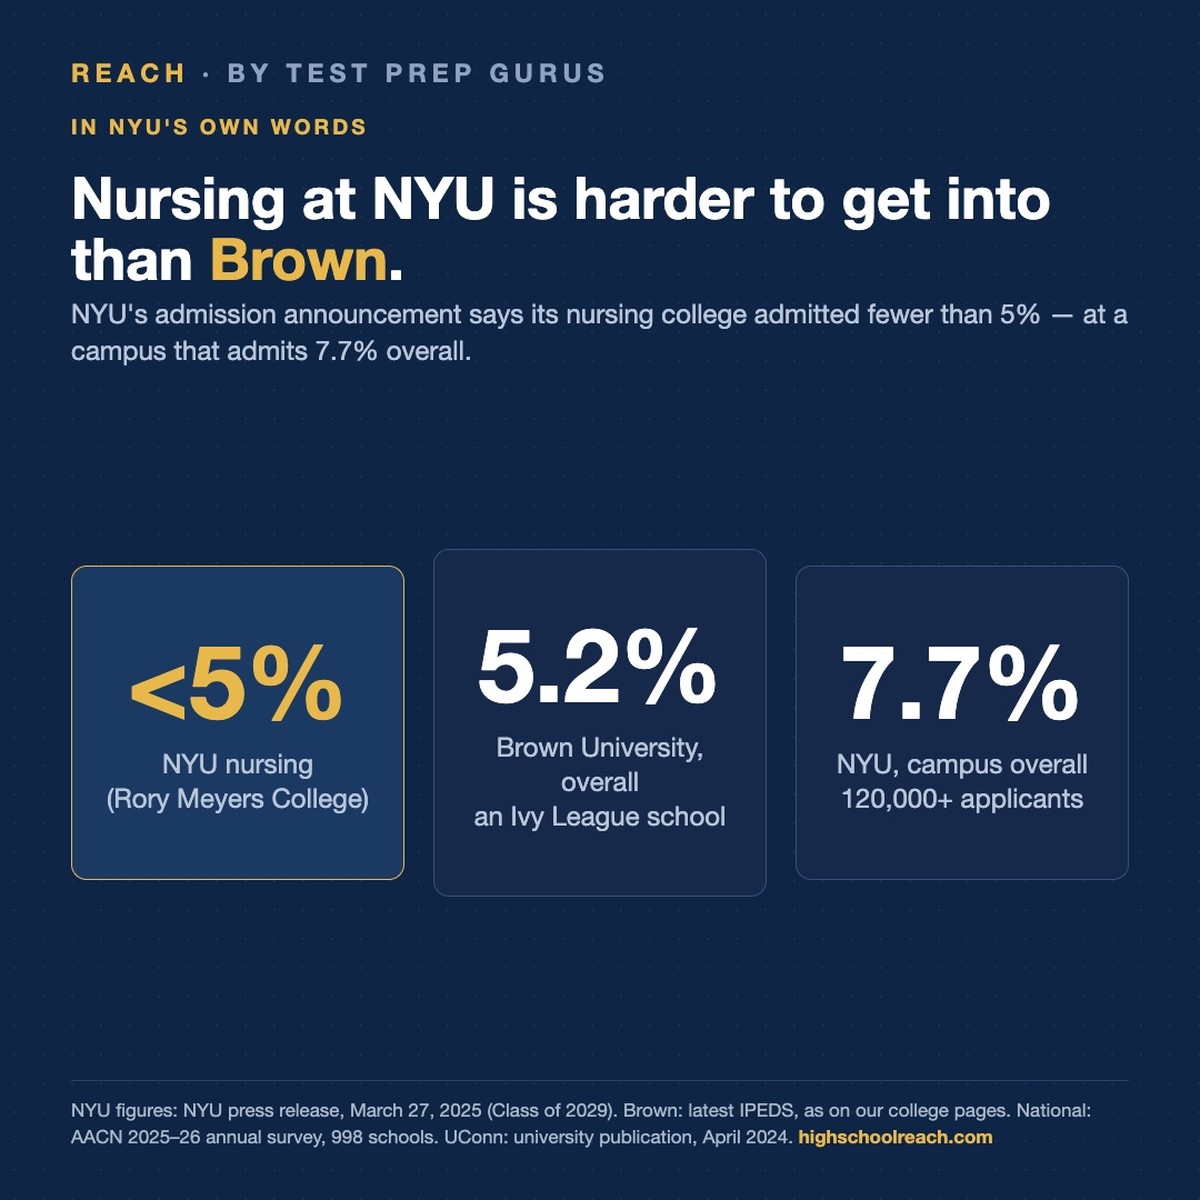
Nursing at NYU is harder to get into than Brown
College admissions · August 21, 2026