Blog · CSU admissions · August 11, 2026
The Admit Rate You Looked Up Isn't the One Your Student Is Facing
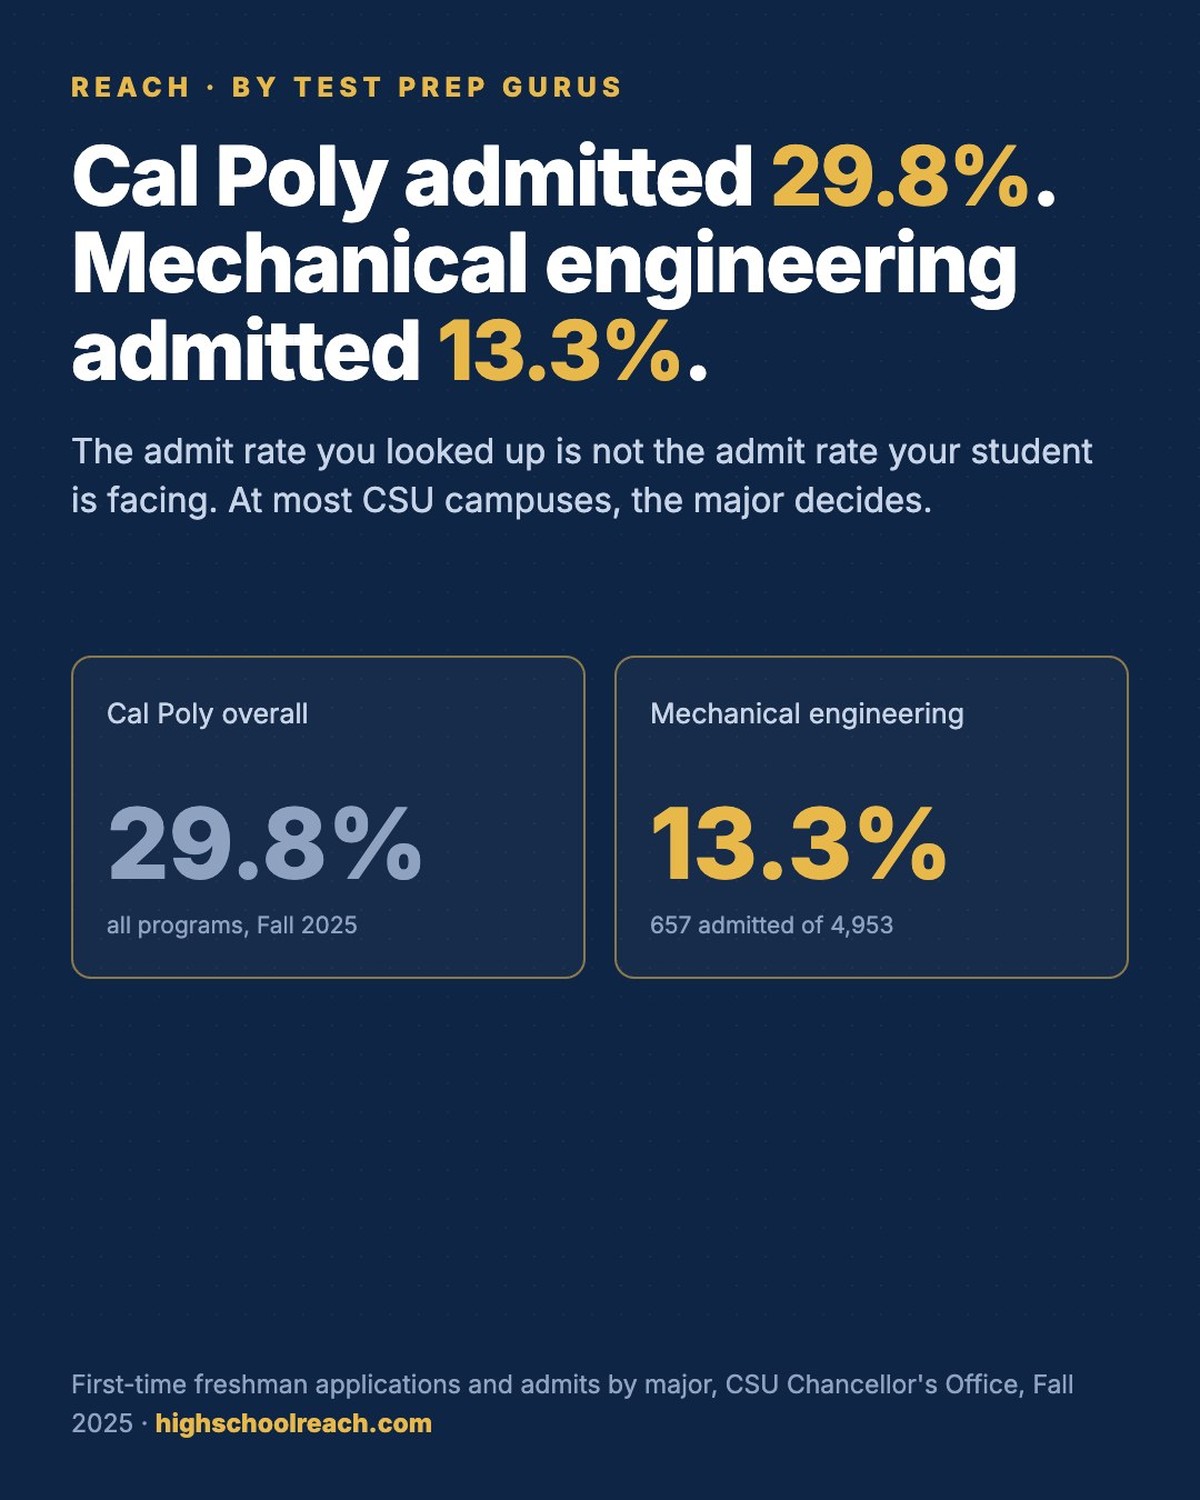
Every fall, families sit down with a college list and write one number next to each school. The admit rate.
It feels like the right number. It is published, it is easy to find, and it sorts a list into reaches and targets in about ten minutes. For Cal Poly San Luis Obispo, that number is 30%.
Now look at the major.
Mechanical engineering at Cal Poly admitted 13.3% last fall. Not 30%. Four thousand nine hundred fifty-three students applied to that program, and 657 got in. Aerospace engineering admitted 12.0%. Political science, on the same campus in the same year, admitted 34.7%.
San Diego State is the one that stops people. The campus admitted 34%. Nursing pre-licensure admitted 3.5% — 8,620 applications, 306 offers. One-tenth of the campus number, at the same front door. That is a twentyfold difference inside one university, and the campus rate splits it down the middle and tells you nothing.
The reason is straightforward. A campus admit rate is an average across programs that have almost nothing to do with each other. Nursing has a fixed number of clinical placements. Computer science expanded. Political science never saw the surge engineering did. Average them together and you get a number that describes the university's paperwork, not your student's odds.
If your student has already decided what they want to study, use the program rate instead. Two things to know before you do. Every program at Cal Poly and San Diego State is impacted, a CSU term meaning the campus adds admission requirements beyond the CSU minimum — a higher GPA bar, specific coursework, or priority for local students. And a rising admit rate usually means fewer applications, not lower standards; do not read a jump as an opening.
We put admit rates by major on all 23 CSU campus pages — applications, admits, the rate, and where that rate stood in 2021 — from the CSU Chancellor's Office. Start with Cal Poly San Luis Obispo or San Diego State.
If you want the same treatment applied to your student's whole list — odds, cost, and earnings by major, side by side — that is what our free Family Decision Report does.
A note on the numbers: the by-major figures are Fall 2025, straight from the CSU Chancellor's Office. The campus-wide rates are the federally reported figures published by each university. We have kept them separate on purpose, because the whole point is that the two do not tell you the same thing. Our methodology page explains how we handle both.
This story also runs on the Test Prep Gurus blog, where we write for families working through admissions decisions right now: read it on the Test Prep Gurus blog.