Hybrid School Of Innovation

Norco · Riverside County · Public

Public Riverside County
Shareable scorecard →

You've seen Hybrid School Of Innovation. What are your child's real college odds? Check any college in 10 seconds — no email needed — then get the free Family Decision Report: Reach / Competitive / Match / Likely + the real cost range for every college on their list. Check odds →

How Hybrid School Of Innovation compares for families

What families should know about Hybrid School Of Innovation.

  • vs Similar SchoolsOther schools in the county, closest in size: 21st Century Learning Institute, Abraham Lincoln Continuation, Adult Evening High (ramona Campus) and 2 more. See the sidebar to compare side-by-side.

For Parents

Get alerts when Hybrid School Of Innovation's numbers change

New admissions results, enrollment shifts, test scores — a few alerts a year, no spam. Your email also saves your list across devices.

Objective, government-grade data — no school pays us for placement.

UC Reach Score methodology
UC Application Reach Score
N/A
10 applications
UC Admit Rate
N/A
— / 10 applications
UC Yield Rate
N/A
— enrolled of — admitted
Yield vs. Enrollment Reach: Yield answers "of UC admits, what % chose UC?" — denominator is just the admits. A small admitted cohort can post a low yield even when the school sends a healthy share of its class to UC.
UC Enrollment Reach Score
N/A
— enrollees / — seniors
Enrollment Reach vs. Yield: Reach answers "of the whole senior class, what share ended up at UC?" — denominator is everyone. High Yield with low Enrollment Reach is common at elite privates: most admits matriculate, but the school sends most of its class to non-UC selective colleges.
Selective UC Reach (UCB, UCLA, UCSD, UCSB, UCI — incl. the Elite two)
N/A
Elite UC Reach (UCB + UCLA)
N/A
Senior Class Size
N/A
Run CDE download to enable the Reach Score
Total School Enrollment
N/A
All grades · CDE Census Day
Avg. Applicant GPA · top-6 UCs
3.36

UC Outcomes Trend — 2022–2025

UC Admit Rate %
UC Reach Score (where available)
UC Admits (count, right axis)

Class size from CDE grade 12 enrollment. Campus-level data: applicant and admit totals count a student once at EACH campus. A senior admitted to UCLA and UC San Diego adds 2 to the admit total, so the total can exceed the senior class — that is the metric working as defined, not an error. The admit RATE is unaffected: both its numerator and denominator are campus-level.

Campus Breakdown — 2025

Campus Applicants Admits Enrollees Admit Rate UC Reach Score Yield Avg GPA (App) Avg GPA (Adm)
UC San Diego → Selective 5 3.27
UC Irvine → Selective 5 3.45
= UCOP-suppressed (count below 3 students, hidden for privacy — actual value is 0, 1, or 2, not necessarily zero). Campus-level totals may count one student admitted to multiple UC campuses more than once; Admit Volume metrics are not the same as UC Reach, which is measured against the whole senior class. See methodology →

What This Means

Note: the UC Reach Score sums campus-level admits across the top-six UC campuses, so a student admitted to both UCLA and UCSD is counted at each. It reflects competitive admit volume relative to class size — admit-events, not distinct students — which is why a Score can exceed 100.
Senior class size is estimated from CDE grade 12 enrollment data. Reach percentages should be interpreted as approximate.
Compare with other schools → See Riverside County rankings →

For School Admins

The full Reach Report for Hybrid School Of Innovation

A board- and LCAP-ready intelligence brief: your enrollment retention and college outcomes, benchmarked against your closest competitors, with a 5-year forecast, concrete steps to act on, and the rigor + outcomes story you can share with your families. Built from primary public data — prepared for you, not auto-generated.

  • Student-retention benchmarking vs your county median — and the LCAP evidence to back your goals
See a sample report →

Related reading

The data Newsom asked for already exists — school by school

UC testing review · August 25, 2026

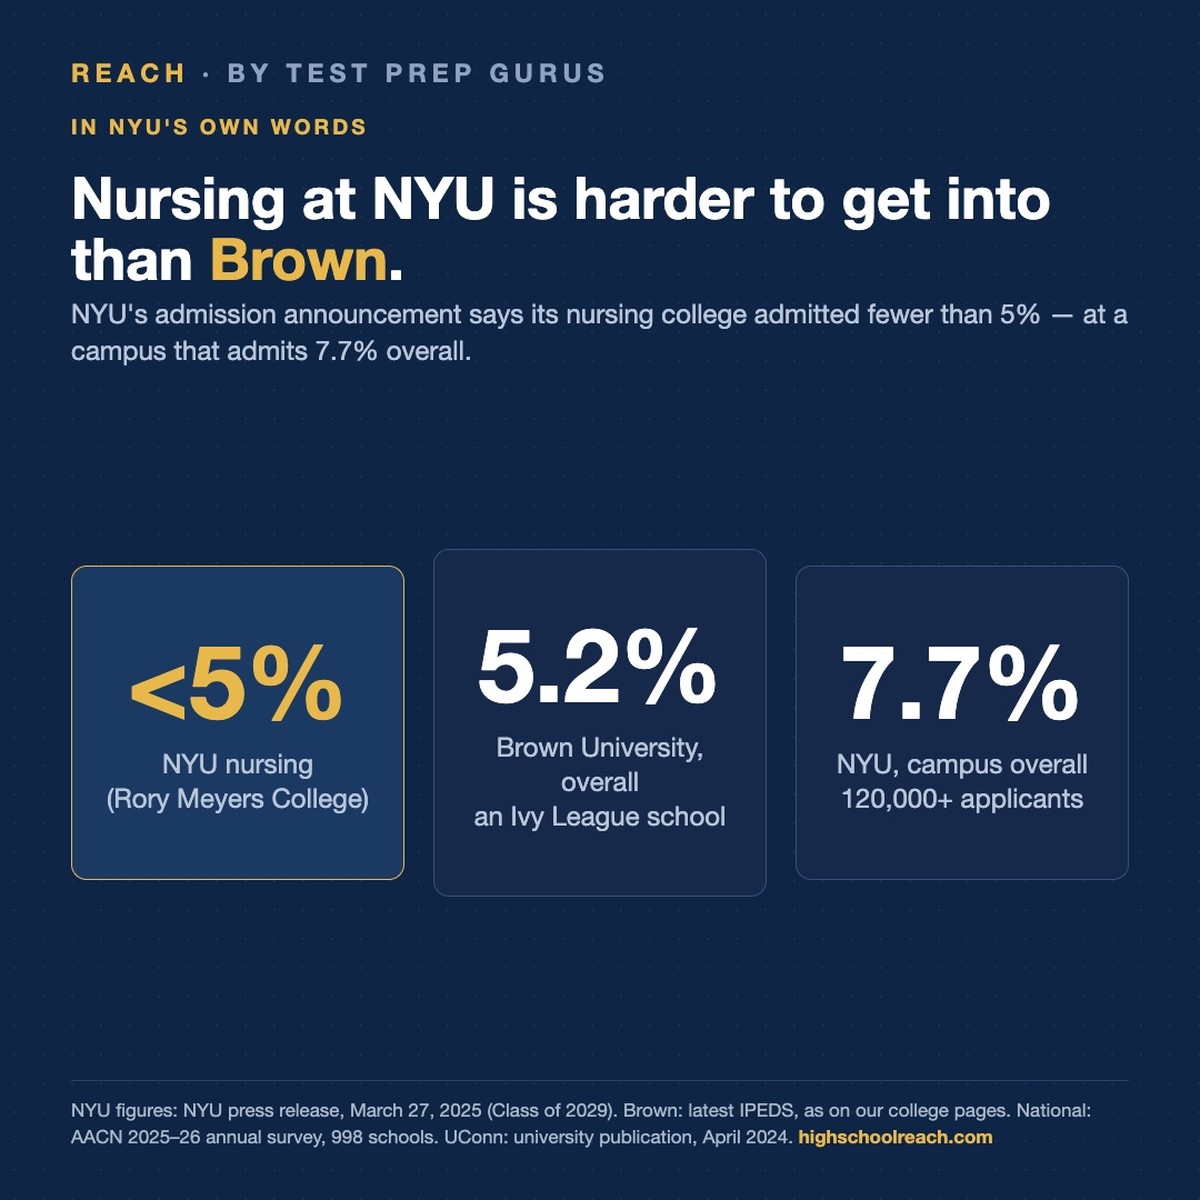
Nursing at NYU is harder to get into than Brown

College admissions · August 21, 2026

All stories from the data →

For Parents

Researching colleges for your kid at Hybrid School Of Innovation?

Check any college's odds in 10 seconds — no email needed — then get the free Family Decision Report: Reach / Competitive / Match / Likely with real admit odds and your real net price, for every college on their list.

Check your child's odds →

For School Admins looking at enrollment trends: request a Reach Report →

What are your child's odds? →

What families ask next