College profile
California State University-East Bay
CA · Public · Large suburb · 13,274 applicants 2023
A parent's read
- The major moves the money more than the admit letter. Registered Nursing, Nursing Administration, Nursing Research and Clinical Nursing grads from here earn about $150,921 four years out; fine and studio arts grads about $46,136 — a 3.3× spread on the same diploma. Have the major conversation before you deposit, not after.
- The payoff holds even at full price: roughly 8× over a decade. With no aid at all — the full in-state ~$22,850/yr — a decade of median earnings (~$71,401/yr) still runs about 8× the four-year cost. This payoff doesn't depend on qualifying for anything. (Out-of-state costs more.)
- Worth asking: do students finish? Only 48% graduate within six years here — the standard federal measure. Ask what drives that: course availability, transfers out, students working long hours. Not finishing is the costliest outcome there is.
Composed from this page's data — every claim is backed by a number in the sections below.
Parent/student verdict
AccessibleAccessible for most applicants. Affordable — net price averages ~$9,320/yr among aid recipients. Major value play for in-state residents.
Best for
- In-state residents (tuition ~$7,583 — major value play)
- Students drawn to Business, Management, & Marketing or Health Professions (the two biggest majors)
- Research-curious students (R2 — active research output)
The reality
- Out-of-state tuition is 2.7× the in-state rate
Verdict is composed from this college's structured data (admit rate, SAT bands, net price with aid and at full price, Carnegie classification, scholarship grids) using transparent rule thresholds — not a chat-bot's opinion.
What are your child's odds here?
Enter their numbers once — this and every college page shows their verdict, and the UC campus cards on California school pages light up with it too. Free, no email.
Weighted is the higher GPA, with honors/AP credit in it — pick whichever your school reports. PSAT scores work in the SAT box.
Institutional snapshot
What kind of college is this?
Source: federal IPEDS Admissions 2023 for scores + admit rate; federal College Scorecard (20260606 vintage) for earnings + outcomes. SAT/ACT bands are the 25th–75th percentile of enrolled submitters.
Admitted-student GPA
Broadly accessible
CSU East Bay admits the large majority of CSU-eligible applicants — there is no selective GPA cutoff. The CSU eligibility floor is an a–g GPA of 2.5 (3.0 for non-residents). Cal State is test-blind, so a solid a–g GPA is what matters.
CSU first-year GPA — verified 2026-06-15 against the campus's official Common Data Set / admissions data. The GPA basis (a–g vs. weighted vs. 4.0-scale) differs from the unweighted GPA shown for private colleges.
Admit rate by major — Fall 2025
The headline admit rate hides a wide spread by program.
First-time freshman applications and admits by major, from the CSU Chancellor's Office. Campus overall: 97%.
| Major | Applicants | Admitted | Admit rate Fall 2025 |
Earlier year for comparison |
|---|---|---|---|---|
| Psychology | 735 | 643 | 87.5% | Fall 2021: 80.7% ↑ |
| Computer Science | 608 | 518 | 85.2% | Fall 2021: 85.4% |
| Criminal Justice | 473 | 406 | 85.8% | Fall 2021: 71.9% ↑ |
| Finance | 424 | 370 | 87.3% | Fall 2021: 80.1% ↑ |
| Business Administration | 403 | 344 | 85.4% | Fall 2021: 79.3% ↑ |
| Art (Studio/Professional Performance) | 400 | 349 | 87.2% | Fall 2021: 81.5% ↑ |
| Health Science | 382 | 328 | 85.9% | Fall 2021: 78.9% ↑ |
| Kinesiology/Physical Education | 376 | 339 | 90.2% | Fall 2021: 82.4% ↑ |
| Marketing | 345 | 291 | 84.3% | Fall 2021: 78.7% ↑ |
| Entrepreneurship | 337 | 277 | 82.2% | Fall 2021: 75.1% ↑ |
| Biology | 325 | 287 | 88.3% | Fall 2021: 82.5% ↑ |
| Civil Engineering | 318 | 283 | 89.0% | Fall 2023: 87.2% ↑ |
| Construction Management | 289 | 250 | 86.5% | Fall 2021: 78.3% ↑ |
| Computer Engineering | 264 | 221 | 83.7% | Fall 2021: 84.6% |
| Political Science/Government | 264 | 235 | 89.0% | Fall 2021: 80.6% ↑ |
| Cell and Molecular Biology | 237 | 216 | 91.1% | Fall 2021: 86.0% ↑ |
| Physiology | 223 | 207 | 92.8% | Fall 2021: 88.1% ↑ |
| Biochemistry | 214 | 196 | 91.6% | Fall 2021: 81.9% ↑ |
| Public Health | 212 | 190 | 89.6% | Fall 2022: 85.4% ↑ |
| Chemistry | 184 | 157 | 85.3% | Fall 2021: 87.0% ↓ |
| Business Economics | 180 | 154 | 85.6% | Fall 2021: 83.6% ↑ |
| Accountancy | 173 | 159 | 91.9% | Fall 2024: 91.0% |
| Liberal Studies | 169 | 153 | 90.5% | Fall 2021: 78.7% ↑ |
| Computer Animation and Game Development | 166 | 149 | 89.8% | Fall 2021: 79.1% ↑ |
| Human Development | 150 | 124 | 82.7% | Fall 2021: 79.2% ↑ |
| Graphic Design | 144 | 129 | 89.6% | Fall 2021: 83.4% ↑ |
| Industrial Engineering | 140 | 122 | 87.1% | Fall 2021: 83.5% ↑ |
| Data Science | 121 | 109 | 90.1% | — |
| Microbiology | 120 | 106 | 88.3% | Fall 2021: 86.5% ↑ |
| Photography | 105 | 91 | 86.7% | Fall 2021: 68.5% ↑ |
| Theatre Arts | 95 | 79 | 83.2% | Fall 2021: 82.0% ↑ |
| Communications | 92 | 76 | 82.6% | Fall 2021: 79.1% ↑ |
| Art | 89 | 75 | 84.3% | Fall 2024: 82.7% ↑ |
| Environmental Science | 81 | 70 | 86.4% | Fall 2021: 79.8% ↑ |
| Creative Writing | 73 | 69 | 94.5% | Fall 2021: 75.8% ↑ |
| Social Work | 73 | 59 | 80.8% | — |
| Communicative Disorders | 70 | 65 | 92.9% | Fall 2021: 92.9% |
| Economics | 69 | 60 | 87.0% | Fall 2021: 81.2% ↑ |
| Music | 59 | 48 | 81.4% | Fall 2021: 22.9% ↑ |
| Mathematics | 56 | 49 | 87.5% | Fall 2021: 84.3% ↑ |
| Hospitality Recreation & Tourism | 52 | 42 | 80.8% | Fall 2021: 71.4% ↑ |
| Physics | 43 | 34 | 79.1% | Fall 2021: 86.0% ↓ |
| Sociology | 40 | 32 | 80.0% | Fall 2021: 80.6% |
| English | 35 | 31 | 88.6% | Fall 2021: 77.1% ↑ |
| Social Science/Social and Behavioral Sciences | 35 | 31 | 88.6% | Fall 2024: 82.4% ↑ |
| History | 33 | 26 | 78.8% | Fall 2021: 69.8% ↑ |
| Ecological Conservation | 32 | 29 | 90.6% | Fall 2021: 85.4% ↑ |
| Quantitative Methods Analysis Business Analytics | 31 | 27 | 87.1% | Fall 2024: 61.5% ↑ |
| Industrial/Organizational Psychology | 30 | 29 | 96.7% | Fall 2021: 76.0% ↑ |
| Gender/Ethnic/Women's Studies | 28 | 24 | 85.7% | Fall 2021: 78.0% ↑ |
| Human Factors | 19 | 16 | 84.2% | Fall 2021: 69.8% ↑ |
| Geology | 18 | 15 | 83.3% | Fall 2021: 92.9% ↓ |
| Statistics | 17 | 14 | 82.4% | Fall 2021: 87.3% ↓ |
| Anthropology | 17 | 12 | 70.6% | Fall 2021: 79.1% ↓ |
| Art History | 14 | 12 | 85.7% | Fall 2021: 85.7% |
| Environmental and Occupational Health | 14 | 12 | 85.7% | Fall 2021: 88.2% ↓ |
| Philosophy | 14 | 10 | 71.4% | Fall 2021: 81.0% ↓ |
| Geography | 14 | 10 | 71.4% | Fall 2021: 84.6% ↓ |
| International Studies/Global Studies | 13 | 11 | 84.6% | Fall 2021: 83.3% ↑ |
Majors reported by transfer path only — Fall 2025
CSU reported no first-year admit row for these majors. At most campuses that means a freshman is not admitted straight into the program: they enter a pre-major (pre-nursing, for example) and apply into it later, while transfer applicants apply to the program directly. The transfer numbers below are the only published gate, and at a program like nursing they are the number a family should plan around.
| Major | Transfer applicants | Admitted | Admit rate Fall 2025, transfer |
Earlier year for comparison |
|---|---|---|---|---|
| Nursing Pre-Licensure transfer path impactedA CSU term: the program gets more qualified applicants than it has seats, so the campus adds admission requirements beyond the CSU minimum — a higher GPA bar, specific courses, or priority for local students. Treat impacted majors as more competitive than the campus's overall admit rate suggests. | 133 | 81 | 60.9% | Fall 2021: 84.8% ↓ |
| Human Resources/Personnel Management transfer path | 46 | 37 | 80.4% | Fall 2021: 56.4% ↑ |
| Recreation Administration transfer path | 39 | 35 | 89.7% | Fall 2021: 68.2% ↑ |
| Spanish transfer path | 34 | 32 | 94.1% | Fall 2021: 94.7% |
Source: CSU Chancellor's Office ↗, applications & admissions by discipline and major (Fall 2021–2025); impaction status from the CSU impacted-programs list (2027-28 cycle). Groups smaller than 10 are suppressed by CSU. A rising admit rate usually means fewer applications, not lower standards.
Outcomes & cost
What graduates actually earn, finish, and owe.
Federal College Scorecard data. Earnings are median annual income measured years after entering. Debt is for federal-aid borrowers only (cash-pay students aren't counted).
The real cost
What California State University-East Bay actually costs
Which side your family lands on isn't set by any national income line — it's set by California State University-East Bay's own aid decision: the gap between its price and your family's finances.
Your odds + estimated cost across your whole college list, side by side.
The payoffTen years of typical graduate pay minus four years of cost — how many dollars ahead a typical graduate runs by year ten. Check both the full-price and with-aid versions to see which applies to you; median pay reflects who a college admits and what they study as much as the college itself., both ways
+$623K ahead at full price +$677K with aidSource: College Scorecard (average net price among Title IV first-time, full-time undergraduates who received aid) and each college's published cost of attendance. We don't show the federal net-price-by-income brackets: their categories were fixed in 2008 and never adjusted, and none of the averages is your family's own number — the full story. Payoff = (10-yr median earnings × 10) − (4 years of cost), in dollars — how far ahead a typical graduate runs by year ten; medians travel with the students a college admits and the majors they choose as much as with the college itself. Full price is the published cost of attendance, largely in-state for publics; earnings are 10 years after enrollment, all majors combined.
What students study here
Most popular majors at California State University-East Bay
Top 5 fields of study by bachelor's degrees awarded (most recent IPEDS Completions). Use this to see what California State University-East Bay actually graduates — not just what it markets.
What those majors earn here
Median earnings 4 years after entry, by major — California State University-East Bay's own graduates, not national averages.
| Major (CIP) | 4-yr earnings |
|---|---|
| Registered Nursing, Nursing Administration, Nursing Research and Clinical Nursing. | $150,921 |
| Computer Science. | $119,900 |
| Construction Management. | $119,067 |
| Industrial Engineering. | $93,793 |
| Biochemistry, Biophysics and Molecular Biology. | $77,863 |
| Business Administration, Management and Operations. | $77,567 |
| Biology, General. | $74,010 |
| Political Science and Government. | $71,022 |
| Health Services/Allied Health/Health Sciences, General. | $68,231 |
| Parks, Recreation, and Leisure Studies. | $68,227 |
Sources: IPEDS Completions (C2023_a; bachelor's-level first majors, 2-digit CIP family — share is of the top 5 only) · College Scorecard program-level outcomes (PP-FOS). Full college-vs-major comparison: /college-outcomes →
Student body & economic mobility
Who attends here — and what the campus adds.
Opportunity Insights data. It measures two things at once: how many lower-income students a college enrols, and how many of them reach the top earnings quintile later. A high rate says the college does both — it does not establish that the campus caused the earnings, because the students it admits differ from the students it doesn't. Read it as a signal about access and destination, not as proof of value added.
Full leaderboards: /college-mobility →
AI program signal
AI + computing education at California State University-East Bay
Full multi-lens comparison: /ai-colleges →
Alternatives to California State University-East Bay
Matched not just by selectivity, but by strategic goal — what a family actually decides on.
Or compare any college side-by-side
Deciding on California State University-East Bay?
Get the full picture in one free report — your child's Reach / Competitive / Match / Likely odds and your real net price, for California State University-East Bay and every other college on your list.
Get your child's odds at California State University-East Bay →Score-odds calculator · Improve the score first · Find merit aid
Feeder high schools
Which high schools send graduates to California State University-East Bay?
Enrolled — from the schools' matriculation lists
2 high schools publish a numbered matriculation list — where their graduates actually enrolled, counted, in the school's own School Profile — and name California State University-East Bay on it. Between them they printed 4 enrolled graduates. Ranked by graduates per class year enrolling at California State University-East Bay, from each school's own published list: the number that school printed, divided by the class years its list covers. The published total and the school's own years label are shown beside every school, so a one-year list and a five-year list can sit on the same page. A list whose class years we cannot read is not divided by a guess — it is listed below with its total instead.
Admitted — from the schools' acceptance lists
3 high schools publish a numbered list of college acceptances — where their graduates were admitted, not where they enrolled — and name California State University-East Bay on it. Between them they printed 17 admissions. Ranked by admissions per class year to California State University-East Bay, from each school's own published acceptances list: the number that school printed, divided by the class years its list covers. Admits are counted at each college a student was admitted to, the same way the UC Reach Score counts a student admitted to three UC campuses three times — so this is a count of admissions, not of students. The published total and the school's own years label are shown beside every school, and a list whose class years we cannot read is listed below with its total rather than divided by a guess.
All 5 feeder schools, ranked →
Counted from each school's own published document, linked on that school's page. A high school that is not here does not publish a numbered list we could read — that is all absence means, and it says nothing about its graduates. Where a school publishes both, the two lists are shown separately: an acceptances list is not a list of enrollments, and the two are never added together.
Related reading
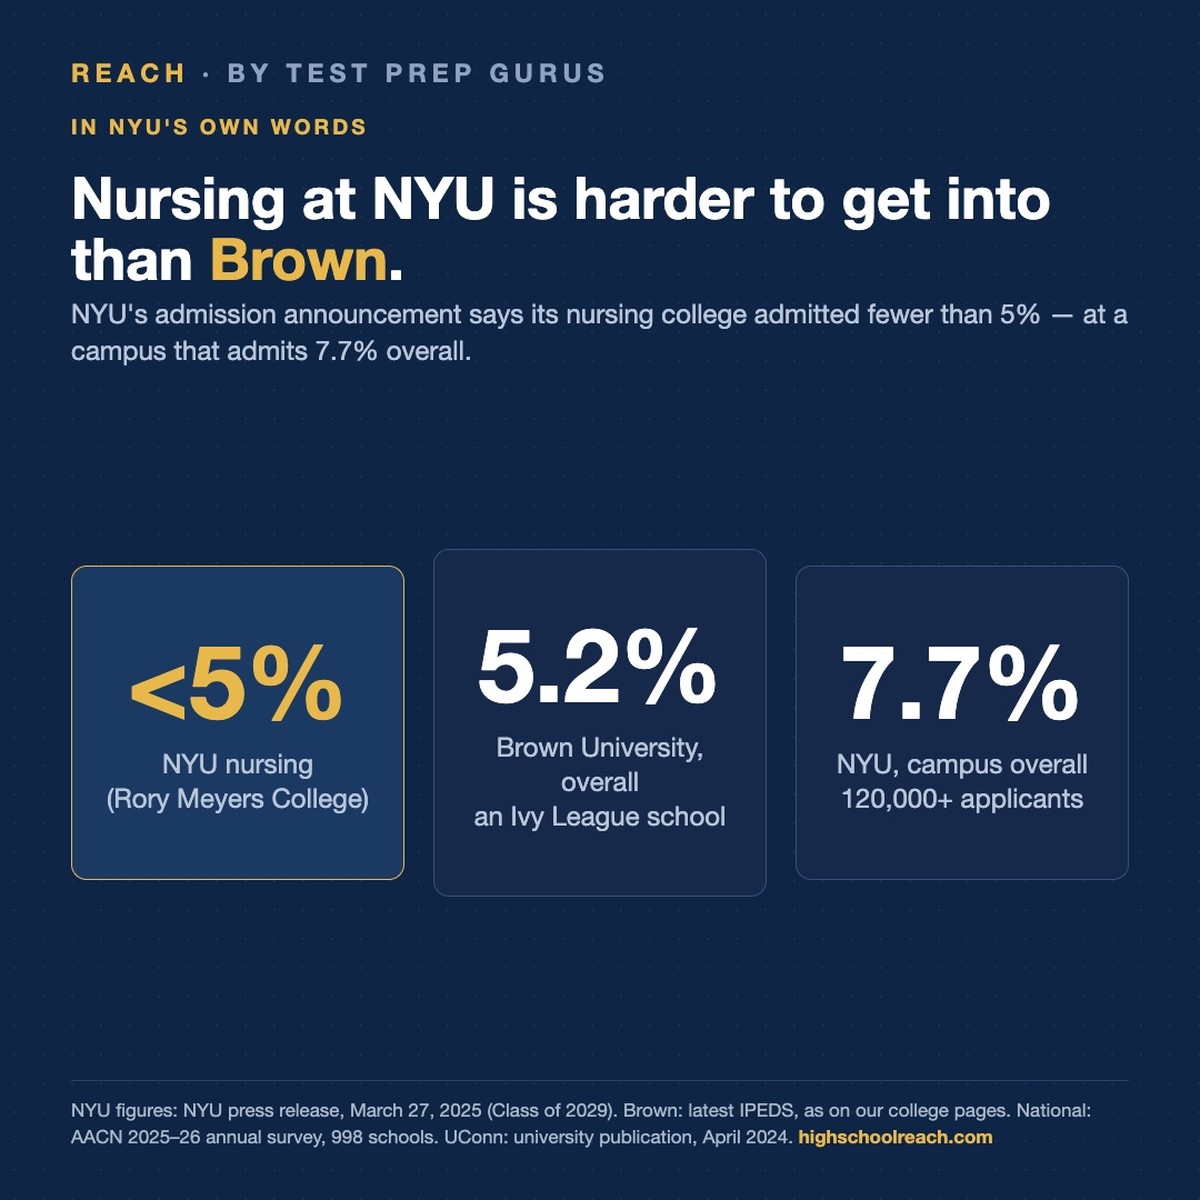
College admissions · August 21, 2026
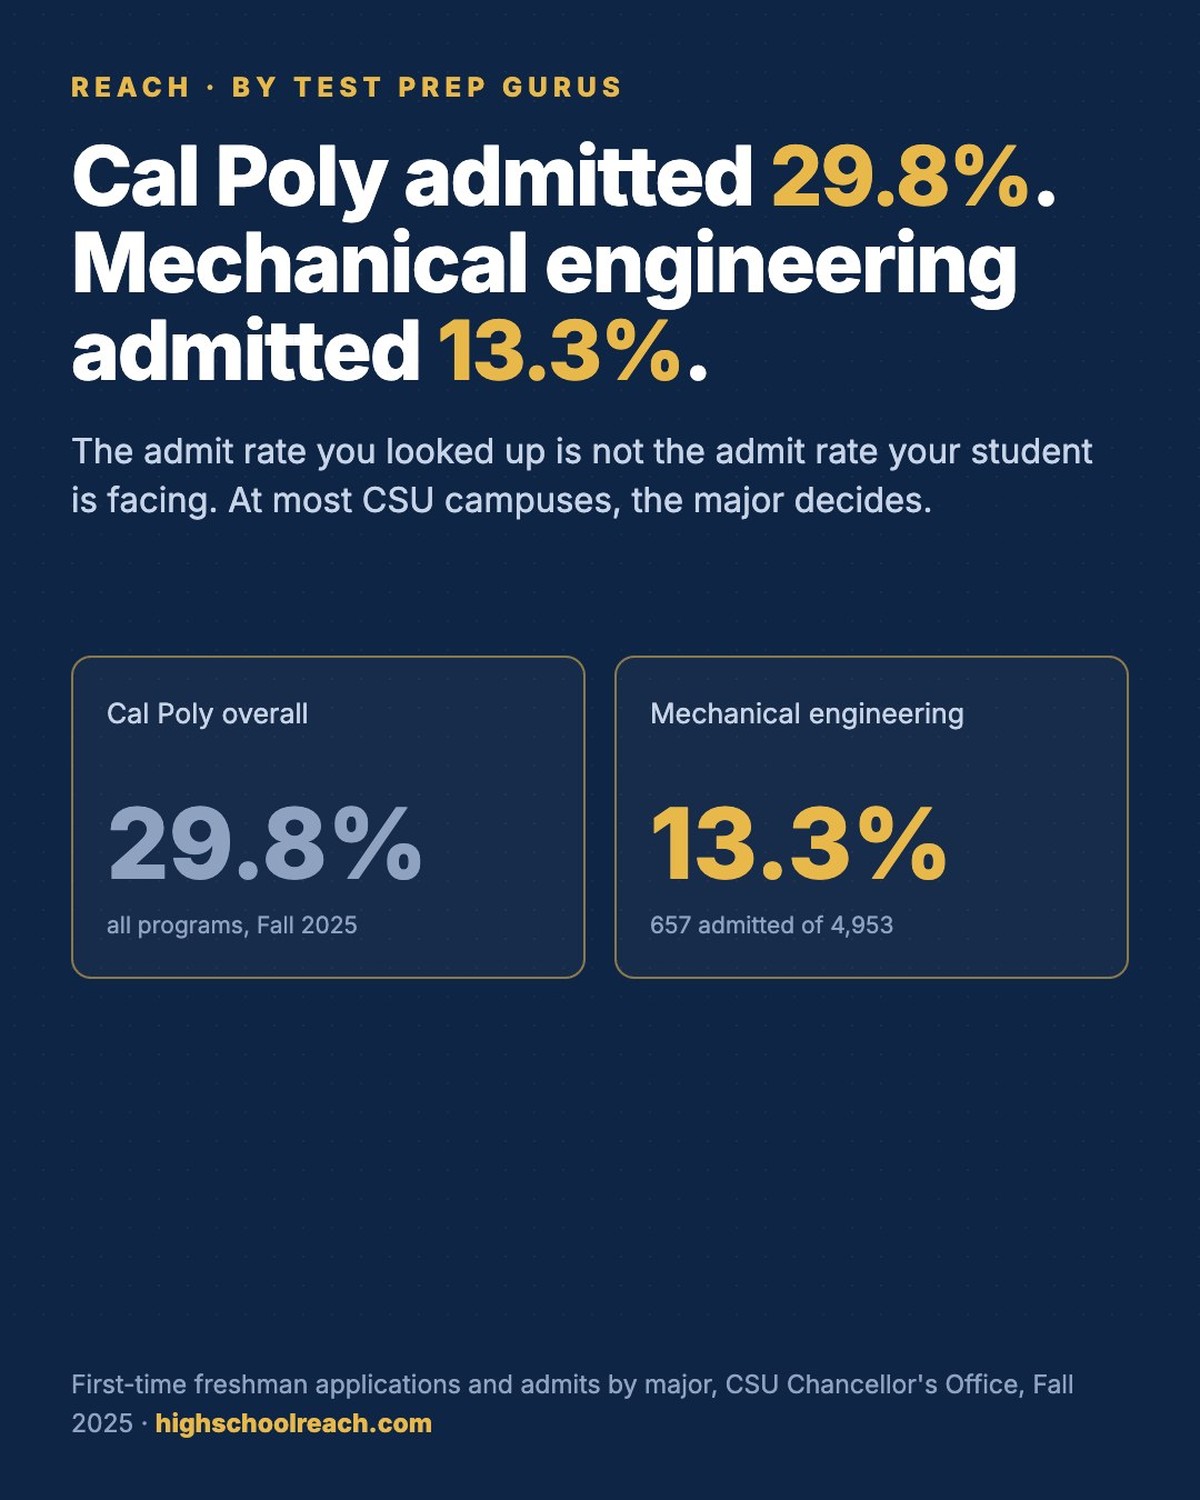
CSU admissions · August 11, 2026
For Parents
Get alerts when California State University-East Bay's numbers change
New admit rates, costs, and outcomes — a few alerts a year, no spam. Your email also saves your list across devices.
Objective, government-grade data — no school pays us for placement.
At a glance
JSON · Using this page with an AI assistantCalifornia State University-East Bay is a public four-year college in CA. It admitted 97% of applicants (13,274 applied, 2023). Test policy: Test-blind.
Cost: about $9,320 a year on average with aid, $22,850 a year at full price for in-state students.
Median earnings ten years after entry: $71,401 a year. Payoff, meaning ten years of that pay minus four years of cost: $676,730 ahead with aid, $622,610 ahead at full price.
Highest median earnings four years after the degree, by program: Registered Nursing, Nursing Administration, Nursing Research and Clinical Nursing ($150,921); Computer Science ($119,900); Construction Management ($119,067).
First-year admit rate by major, Fall 2025: lowest Entrepreneurship 82.2% (337 applied); highest Physiology 92.8% (223 applied). 4 majors are reported on the transfer side only (freshmen enter as a pre-major): Nursing Pre-Licensure 60.9%, Human Resources/Personnel Management 80.4%, Recreation Administration 89.7%, Spanish 94.1%.
Economic mobility (Opportunity Insights): 10% of students came from families in the bottom fifth of income, and 44% of those reached the top fifth as adults.
Nursing: freshmen enter as pre-nursing and apply into the program later; NCLEX-RN first-time pass rate 86.8% (2024/2025, California Board of Registered Nursing).
High schools that publish a numbered matriculation list and name California State University-East Bay: 2, 4 enrolled students between them — ranked by graduates per class year, most often Saint Joseph-Notre Dame High School (3.0 per class year, 3 over 1 class year, Class of 2026); York School (0.2 per class year, 1 over 6 class years, Classes of 2021-2026). Each figure is the number that school printed divided by the class years its own list covers; the totals and years are shown. These are the schools that publish such a list, not every school that sends students; full list: https://highschoolreach.com/leaderboards/feeder-schools/california-state-university-east-bay.
High schools that publish a numbered list of college acceptances naming California State University-East Bay: 3, 17 admissions between them — ranked by admissions per class year, most often Archbishop Mitty High School (13.0 per class year, 13 over 1 class year, Class of 2025); Lycée Français de San Francisco (1.0 per class year, 3 over 3 class years, Classes 2022, 2023, 2024); Canterbury School-Fort Myers (1.0 per class year, 1 over 1 class year, Class of 2026). Admits are counted at each college, so this counts admissions, not students. These are a different set of documents from the matriculation lists above and the two are never added together; full list: https://highschoolreach.com/leaderboards/feeder-schools/california-state-university-east-bay.
Machine-readable version of this page: https://highschoolreach.com/colleges/california-state-university-east-bay.json