County Sort table by Diagnosis Type Year Reset filters

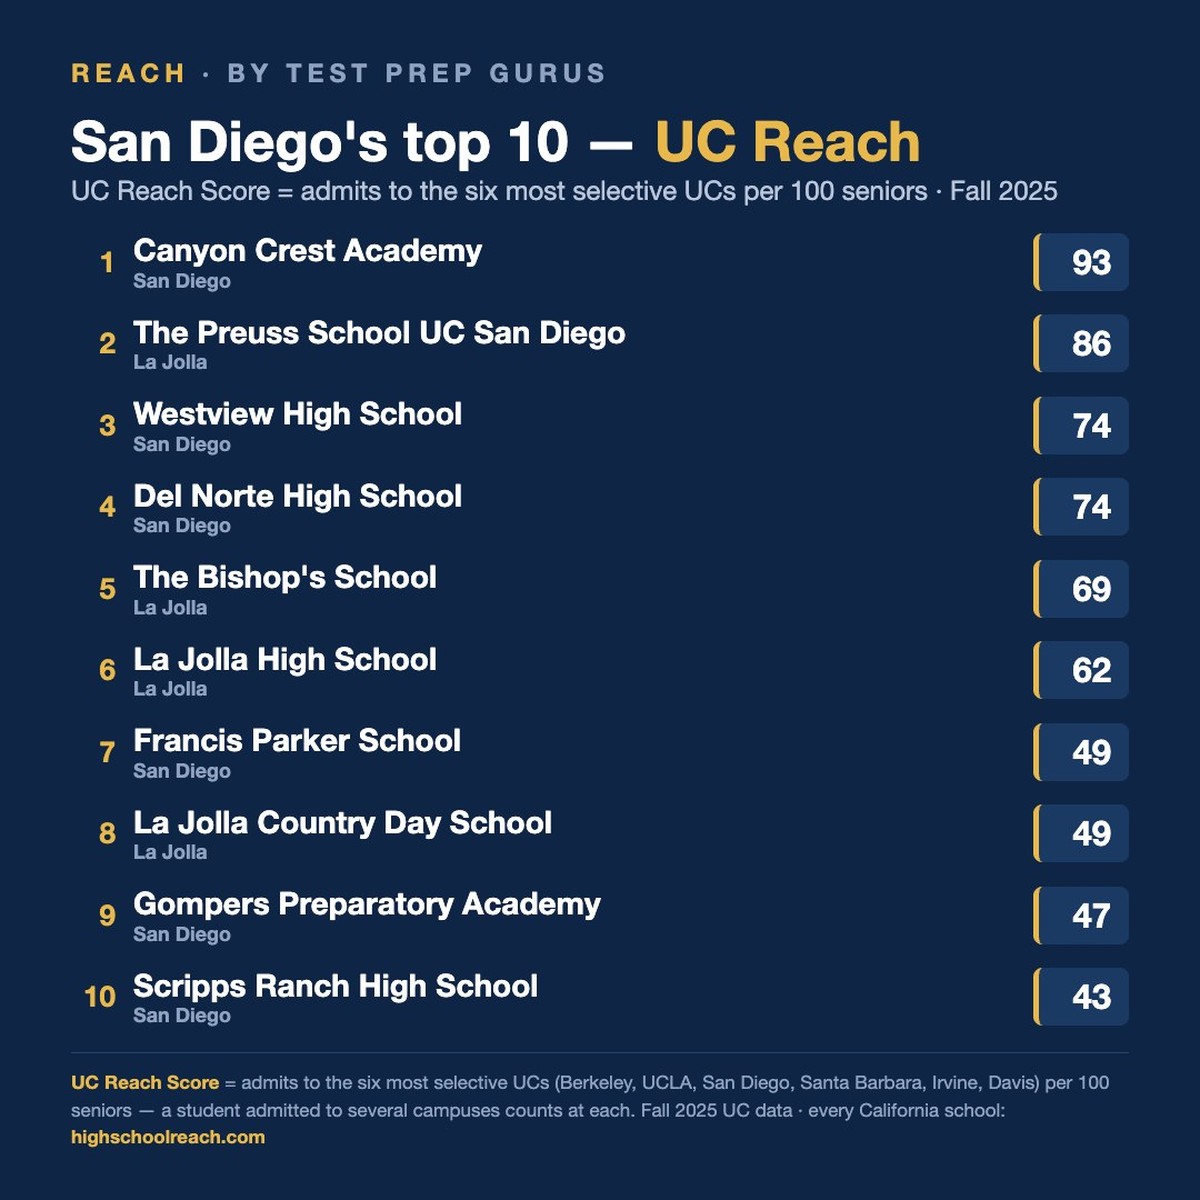
🏆 Top 10 in San Diego County — UC Reach Score

San Diego County · 2025 · ≥50 seniors
What is UC Reach? UC Reach = unique top-6 UC admits ÷ senior class size — the share of a school's entire graduating class that reaches the six most selective UCs (Berkeley, UCLA, San Diego, Santa Barbara, Irvine, Davis). It's a better gauge of school-wide success than admit rate, which only reflects the handful of students who applied.
Why it beats admit rate: if 6 students apply to the top UCs and all get in, that's a 100% admit rate — but at a 1,000-senior school it's a UC Reach Score of just 0.6 (6 ÷ 1,000). By contrast, a school where 250 of 1,000 seniors land a top-UC admit has a UC Reach Score of 25 — far stronger, even though its admit rate is lower.
Why some schools are over 100? Out of every 100 seniors at these schools, the class is generating more than 100 admissions to the six most selective UCs — meaning the typical strong student is getting in at multiple top campuses (UCLA + UCSD, or Berkeley + UCSB + Irvine, for example). It's a rare achievement: fewer than 1% of California high schools clear a UC Reach Score of 100.

Leaderboards by type — San Diego County (2025)

Top and bottom schools by UC Reach, split public/charter vs private (≥50 seniors). Scoped to San Diego County — change the County filter above to rescope.

▲ Top 10 Public + Charter

San Diego County

1
San Diego · Public
93
2
La Jolla · Public
86
3
San Diego · Public
74
4
San Diego · Public
74
5
La Jolla · Public
62
6
San Diego · Public
47
7
San Diego · Public
43
8
Encinitas · Public
42
9
San Diego · Public
41
10
San Diego · Public
41

▲ Top 10 Private

San Diego County

1
San Diego · Private
49
2
La Jolla · Private
49
3
Carlsbad · Private
38
4
Chula Vista · Private
35
5
Solana Beach · Private
33
6
San Diego · Private
33
7
San Diego · Private
33
8
San Diego · Private
14
9
El Cajon · Private
2

▼ Bottom 10 Public + Charter

San Diego County

1
San Diego · Public
2
2
El Cajon · Public
8
3
Santee · Public
8
4
· Public
8
5
· Public
8
6
Ramona · Public
9
7
· Public
9
8
La Mesa · Public
9
9
Oceanside · Public
10
10
Valley Center · Public
11

▼ Bottom 10 Private

San Diego County

1
El Cajon · Private
2
2
San Diego · Private
14
3
San Diego · Private
33
4
San Diego · Private
33
5
Solana Beach · Private
33
6
Chula Vista · Private
35
7
Carlsbad · Private
38
8
La Jolla · Private
49
9
San Diego · Private
49

🎯 Specialized high schools — San Diego County · 2025

Top UC Reach for schools with senior classes of 25–99. These are typically magnet programs, specialized charters, and small Catholic preps — too small to compare cleanly against comprehensive public high schools, but the most UC-effective small schools in California are here.

▲ Top 10 Small Public + Charter

San Diego County

1
San Diego · Public
37
2
San Marcos · Public
29
3
· Public
24
4
San Diego · Public
19
5
San Diego · Public
19
6
San Diego · Public
16
7
Lakeside · Public
11
8
San Diego · Public
11
9
Bonsall · Public
8
10
· Public
5

▲ Top 10 Small Private

San Diego County

1
San Diego · Private
52
2
Vista · Private
29
3
Carlsbad · Private
23
4
San Diego · Private
22
5
San Diego · Private
8
6
San Diego · Private
6

Top 10 by individual UC campus — San Diego County · 2025

Where each UC campus lands its admits, as a share of each high school's senior class. Same 50-senior floor.

Top 10 — UCB Reach

UC Berkeley

1
La Jolla · Public
10
2
San Diego · Private
8
3
La Jolla · Public
8
4
La Jolla · Private
7
5
San Diego · Public
6
6
San Diego · Public
5
7
San Diego · Public
5
8
San Diego · Public
5
9
San Diego · Public
5
10
San Diego · Public
4

Top 10 — UCLA Reach

UCLA

1
San Diego · Public
8
2
La Jolla · Public
7
3
La Jolla · Public
5
4
San Diego · Private
5
5
San Diego · Public
5
6
San Diego · Public
4
7
La Jolla · Private
4
8
Encinitas · Public
4
9
San Diego · Private
4
10
San Diego · Public
4

Top 10 — UCSD Reach

UC San Diego

1
La Jolla · Public
39
2
San Diego · Public
16
3
San Diego · Public
15
4
San Diego · Public
11
5
Chula Vista · Public
11
6
San Diego · Public
10
7
San Diego · Public
10
8
Carlsbad · Public
9
9
San Marcos · Public
9
10
Chula Vista · Public
9

Top 10 — UCSB Reach

UC Santa Barbara

1
San Diego · Public
28
2
La Jolla · Public
20
3
San Diego · Public
18
4
San Diego · Public
17
5
San Diego · Private
14
6
Carlsbad · Private
14
7
San Diego · Public
12
8
Chula Vista · Public
12
9
San Diego · Public
12
10
Solana Beach · Private
11

Top 10 — UCI Reach

UC Irvine

1
San Diego · Public
30
2
San Diego · Public
27
3
San Diego · Public
16
4
San Diego · Public
16
5
San Diego · Public
14
6
La Jolla · Public
12
7
Chula Vista · Public
10
8
Carlsbad · Private
8
9
San Diego · Public
8
10
La Jolla · Public
7

Top 10 — UCD Reach

UC Davis

1
San Diego · Public
22
2
La Jolla · Private
16
3
La Jolla · Public
14
4
La Jolla · Public
13
5
San Diego · Public
13
6
San Diego · Public
12
7
San Diego · Public
12
8
San Diego · Private
11
9
Chula Vista · Private
11
10
San Diego · Public
11

Beyond UC Reach — more lenses on San Diego County

UC Reach measures who gets in. These lenses measure the upstream pipeline (A-G), the downstream outcome (UC graduation), the capacity that drives the pipeline (counselors), reliability over time (consistency), grade-11 academic preparation (CAASPP SBAC ELA & Math), and private-school financial strength. Click any school for its full profile.

Top 10 — A-G Completion

% of graduates meeting UC/CSU course requirements · 2024-25 cohort

1
San Diego · Public
100.0%
2
· Public
100.0%
3
· Public
100.0%
4
San Diego · Public
98.9%
5
San Diego · Public
98.6%
6
San Diego · Public
96.3%
7
La Mesa · Public
95.6%
8
San Diego · Public
95.1%
9
· Public
91.9%
10
· Public
90.4%

Top 10 — UC 6-Yr Grad Rate

% of UC entrants who finished in 6 years · cohort N ≥ 20

1
La Jolla · Public
96.8%
2
Chula Vista · Public
96.4%
3
El Cajon · Public
96.2%
4
San Diego · Public
95.9%
5
San Diego · Public
95.3%
6
El Cajon · Public
95.2%
7
Ramona · Public
95.2%
8
San Diego · Public
95.0%
9
San Diego · Public
94.6%
10
San Diego · Public
94.6%

Top 10 — Best Counselor Capacity

Lowest students-per-counselor (ASCA target 250:1) · public/charter, ≥500 students

1
Imperial Beach · Public
170:1
2
· Public
174:1
3
· Public
188:1
4
Coronado · Public
198:1
5
· Public
201:1
6
Chula Vista · Public
202:1
7
· Public
214:1
8
· Public
241:1
9
Escondido · Public
252:1
10
San Diego · Public
259:1

Top 10 — Most Consistent

Lowest UC Reach std-dev across 5 years (above-CA-median mean)

1
avg 25.2 · σ 1.93
σ 1.93
2
avg 34.1 · σ 3.46
σ 3.46
3
avg 28.5 · σ 3.68
σ 3.68
4
avg 37.7 · σ 3.74
σ 3.74
5
avg 24.3 · σ 3.78
σ 3.78
6
avg 27.1 · σ 4.13
σ 4.13
7
avg 25.3 · σ 4.47
σ 4.47
8
avg 22.8 · σ 4.66
σ 4.66
9
avg 34.6 · σ 5.09
σ 5.09
10
avg 29.7 · σ 5.47
σ 5.47

Top 10 — SBAC ELA met/exceeded

% Met or Exceeded Standard · Grade 11 CAASPP · public/charter · tested ≥30

1
San Diego · n=561 · 2025
93%
2
Oceanside · n=407 · 2025
89%
3
Lakeside · n=37 · 2025
86%
4
San Diego · n=487 · 2025
85%
5
San Diego · n=488 · 2025
85%
6
San Diego · n=586 · 2025
84%
7
La Mesa · n=584 · 2025
84%
8
· n=80 · 2025
84%
9
· n=104 · 2025
84%
10
· n=36 · 2025
83%

Top 10 — SBAC Math met/exceeded

% Met or Exceeded Standard · Grade 11 CAASPP · public/charter · tested ≥30

1
San Diego · n=559 · 2025
86%
2
San Diego · n=580 · 2025
74%
3
San Diego · n=475 · 2025
70%
4
San Diego · n=487 · 2025
69%
5
La Mesa · n=582 · 2025
68%
6
Lakeside · n=37 · 2025
65%
7
Carlsbad · n=296 · 2025
59%
8
San Diego · n=447 · 2025
59%
9
San Diego · n=521 · 2025
56%
10
San Diego · n=584 · 2025
56%

Top 10 — Private Net Assets

Wealthiest CA private high schools · IRS Form 990 · latest fiscal year

1
La Jolla · Nonsectarian · FY 2023
$61.0M
2
Solana Beach · Other religious · FY 2023
$47.0M
3
San Diego · Other religious · FY 2023
$44.9M
4
Carlsbad · Nonsectarian · FY 2023
$33.5M
5
San Diego · Other religious · FY 2023
$21.1M
6
Encinitas · Nonsectarian · FY 2023
$20.1M
7
Escondido · Other religious · FY 2023
$8.1M
8
El Cajon · Other religious · FY 2023
$4.0M
9
San Diego · Catholic · FY 2023
$682,977

Reach momentum — biggest gains & declines over time

≥50 seniors · earliest→latest year

Which schools are moving a growing — or shrinking — share of their graduating class into the six most selective UCs. Reflects the current county/type filter.

▲ Biggest gains

SchoolThen → NowΔ
San Diego · Public
26 '18 → 44 '23 +18.8pp
Chula Vista · Public
14 '18 → 29 '25 +15.2pp
San Diego · Public
10 '18 → 23 '25 +13.6pp
La Jolla · Public
73 '19 → 86 '25 +13.3pp
San Diego · Public
9 '18 → 22 '25 +12.8pp
Solana Beach · Private
21 '20 → 33 '25 +12.6pp
San Diego · Public
27 '19 → 39 '25 +11.8pp
San Diego · Public
16 '18 → 26 '25 +10.0pp
San Marcos · Public
21 '18 → 31 '25 +9.7pp
· Public
11 '18 → 20 '25 +9.5pp

▼ Biggest declines

SchoolThen → NowΔ
Chula Vista · Public
65 '18 → 36 '25 -29.0pp
Carlsbad · Private
62 '20 → 38 '25 -24.0pp
San Diego · Public
63 '18 → 41 '25 -22.0pp
San Diego · Public
62 '18 → 41 '25 -20.6pp
La Jolla · Private
68 '20 → 49 '25 -19.5pp
El Cajon · Private
19 '20 → 2 '25 -16.2pp
San Diego · Private
47 '20 → 33 '25 -14.3pp
· Public
21 '18 → 8 '25 -13.1pp
San Diego · Public
34 '18 → 21 '25 -13.0pp
San Diego · Public
24 '18 → 12 '25 -12.2pp

Demand momentum — biggest gaps vs the county baseline

grade-12 enrollment Δ vs. county · ≥80 students

The demographic tide is shrinking CA enrollment ~10% over 7 years statewide, so absolute decline alone is noise. The gap vs the county baseline is the actionable signal — schools losing share faster than their demographic floor are the ones to watch. Reflects the current county/type filter.

▲ Outperforming the county the most

SchoolSchool · CountyGap
San Diego · San Diego · Public  Demand hides churn
+147.1% vs -7.8% +154.9pp
Spring Valley · San Diego · Public  Demand hides churn
+42.1% vs -7.8% +49.9pp
San Diego · San Diego · Public  Best in class
+37.9% vs -7.8% +45.7pp
San Diego · San Diego · Public  Best in class
+25.9% vs -7.8% +33.7pp
Santee · San Diego · Public  Strong demand
+25.5% vs -7.8% +33.3pp
San Diego · San Diego · Public  Best in class
+24.6% vs -7.8% +32.4pp
San Diego · San Diego · Public  Demand hides churn
+22.5% vs -7.8% +30.3pp
Lakeside · San Diego · Public  Best in class
+22.3% vs -7.8% +30.1pp
La Jolla · San Diego · Public  Best in class
+17.3% vs -7.8% +25.1pp
Carlsbad · San Diego · Public  Best in class
+7.9% vs -7.8% +15.7pp

▼ Underperforming the county the most

SchoolSchool · CountyGap
· San Diego · Public  Compounding decline
-66.2% vs -7.8% -58.4pp
· San Diego · Public  Compounding decline
-34.5% vs -7.8% -26.7pp
Escondido · San Diego · Public  Compounding decline
-31.9% vs -7.8% -24.1pp
Chula Vista · San Diego · Public  Sharp downturn
-29.6% vs -7.8% -21.8pp
San Diego · San Diego · Public  Material decline
-28.8% vs -7.8% -21.0pp
· San Diego · Public  Material decline
-26.7% vs -7.8% -18.9pp
San Diego · San Diego · Public  Sharp downturn
-25.9% vs -7.8% -18.1pp
San Diego · San Diego · Public  Material decline
-25.6% vs -7.8% -17.8pp
Escondido · San Diego · Public  Material decline
-25.6% vs -7.8% -17.8pp
Vista · San Diego · Public  Material decline
-25.4% vs -7.8% -17.6pp

GPA Performance — over/under their predicted UC admit rate

79 schools eligible · 2025

Each dot is one school. The diagonal is the per-campus GPA expectation — points above it admit students at higher rates than their GPA mix predicts; points below admit at lower rates. Schools need ≥30 top-6 UC applications and data across ≥3 campuses to appear.

▲ Top 10 outperformers

School GPA Actual Δ vs exp.
San Diego · Public
3.92 40.0% +18.7pp
Chula Vista · Public
3.93 39.0% +16.5pp
San Diego · Public
3.91 33.3% +14.4pp
Chula Vista · Public
4.01 33.6% +13.1pp
San Diego · Public
4.01 36.0% +12.9pp
Ramona · Public
3.95 38.4% +10.5pp
Escondido · Public
3.91 30.4% +9.8pp
El Cajon · Public
3.74 30.6% +9.4pp
· Public
3.67 35.0% +9.2pp
San Diego · Public
3.84 29.2% +8.9pp

▼ Top 10 underperformers

School GPA Actual Δ vs exp.
San Diego · Public
4.00 17.8% -4.7pp
San Diego · Public
4.03 18.5% -4.6pp
· Public
3.79 15.5% -4.4pp
Chula Vista · Public
3.92 16.8% -3.6pp
San Diego · Public
4.03 18.7% -3.2pp
Spring Valley · Public
3.85 17.3% -3.2pp
San Diego · Public
4.00 19.1% -3.0pp
San Diego · Public
4.03 22.3% -2.8pp
Carlsbad · Public
4.07 20.5% -2.7pp
Carlsbad · Public
4.00 19.8% -2.0pp

Full rankings — every San Diego County high school by UC Reach Score

Sortable by any column. Click a column header to sort. Click any school row to open its profile.

126 schools · 2025 data · Page 1 of 2 (showing 1–100)
Apply 50-senior floor Compare selected schools →
# School County Seniors Total Enroll UC Reach Score App Reach Score Admit Rate Yield Selective Reach Elite Reach Raw Apps Raw Admits
1
San Diego · Public  Best in class
San Diego 546 2,147 93 402 23.0% 20.0% 70.3 13.4 2,196 506
2
La Jolla · Public  Best in class
San Diego 115 825 86 311 27.6% 37.4% 73.0 17.4 358 99
3
San Diego · Public  Holding share
San Diego 543 2,116 74 264 28.1% 28.5% 62.6 8.7 1,432 403
4
San Diego · Public  Best in class
San Diego 643 2,557 74 307 23.9% 30.2% 61.7 9.5 1,975 473
5
La Jolla · Public  Sharp downturn
San Diego 288 1,174 62 243 25.8% 19.4% 48.6 12.8 699 180
6
San Diego · Public  Best in class
San Diego 23 138 52 157 33.3% 52.2 13.0 36 12
7
San Diego · Private
San Diego 27 390 52 256 20.3% 37.0 69 14
8
San Diego · Private
San Diego 141 1,279 49 282 17.4% 8.7% 37.6 12.8 397 69
9
La Jolla · Private
San Diego 119 1,099 49 246 19.8% 6.9% 32.8 10.9 293 58
10
San Diego · Public  Best in class
San Diego 152 1,175 47 210 22.6% 19.4% 39.5 9.2 319 72
11
San Diego · Public  Best in class
San Diego 463 1,890 43 241 17.8% 26.3% 31.8 6.0 1,115 198
12
Encinitas · Public  Holding share
San Diego 547 1,843 42 197 21.4% 30.3% 31.4 8.2 1,078 231
13
San Diego · Public  Best in class
San Diego 642 2,536 41 217 19.1% 25.7% 32.2 7.8 1,390 265
14
San Diego · Public  Sharp downturn
San Diego 100 412 41 173 23.7% 24.4% 31.0 9.0 173 41
15
Carlsbad · Public  Best in class
San Diego 352 1,289 40 201 19.8% 32.1% 29.8 5.7 708 140
16
San Diego · Public  Best in class
San Diego 440 1,800 39 166 23.5% 37.8% 34.1 2.0 731 172
17
San Diego · Public
San Diego 103 435 39 167 23.3% 7.5% 26.2 2.9 172 40
18
Carlsbad · Private
San Diego 120 661 38 250 15.3% 32.5 3.3 300 46
19
San Diego · Public  Watch — engagement
San Diego 98 355 37 151 24.3% 19.4% 28.6 11.2 148 36
20
Chula Vista · Public
San Diego 151 626 36 160 22.8% 10.9% 30.5 4.0 241 55
21
Chula Vista · Private
San Diego 294 1,222 35 187 18.9% 23.1% 24.1 4.8 549 104
22
San Diego · Public  Best in class
San Diego 538 2,210 34 150 22.7% 33.9% 28.6 2.4 807 183
23
Solana Beach · Private
San Diego 114 1,095 33 129 25.9% 7.9% 26.3 5.3 147 38
24
San Diego · Private
San Diego 181 722 33 179 18.5% 11.7% 23.2 6.6 324 60
25
San Diego · Public  Sharp downturn
San Diego 388 1,465 33 177 18.7% 28.1% 25.0 4.6 686 128
26
San Diego · Private
San Diego 399 1,661 33 153 21.4% 24.4% 24.6 6.5 611 131
27
San Marcos · Public  Best in class
San Diego 680 2,751 31 104 29.6% 30.6% 25.0 2.8 706 209
28
Encinitas · Private
San Diego 23 157 30 209 14.6% 30.4 17.4 48 7
29
Chula Vista · Public  Demand problem
San Diego 578 2,289 30 129 23.4% 29.1% 25.4 3.1 748 175
30
Chula Vista · Public  Material decline
San Diego 489 1,960 29 114 25.8% 34.7% 25.1 5.1 558 144
31
Coronado · Public  Weak at the gate
San Diego 263 999 29 144 20.4% 23.4% 19.0 5.7 378 77
32
San Marcos · Public
San Diego 90 409 29 154 18.7% 22.2 139 26
33
Vista · Private
San Diego 63 758 29 129 22.2% 22.2 81 18
34
Poway · Public  Holding share
San Diego 550 2,101 28 102 27.5% 31.8% 20.7 2.7 560 154
35
Oceanside · Public  Best in class
San Diego 398 1,670 28 130 21.5% 35.1% 20.6 3.3 517 111
36
La Mesa · Public  Best in class
San Diego 621 2,554 27 127 21.1% 31.7% 19.6 3.4 791 167
37
Carlsbad · Public  Best in class
San Diego 573 2,336 26 94 27.9% 26.5% 20.4 4.2 541 151
38
San Diego · Public  Best in class
San Diego 265 1,240 26 129 20.1% 21.7% 16.6 4.5 343 69
39
San Diego · Public  Demand hides churn
San Diego 480 1,602 26 102 25.2% 33.1% 20.6 4.4 492 124
40
San Diego · Public  Best in class
San Diego 400 1,724 24 133 18.5% 33.7% 17.8 3.8 531 98
41
San Marcos · Public  Best in class
San Diego 777 3,067 24 116 21.1% 29.5% 19.6 3.2 901 190
42
· Public  Strong demand
San Diego 46 88 24 143 16.7% 27.3% 15.2 66 11
43
Carlsbad · Private
San Diego 60 272 23 162 14.4% 42.9% 13.3 97 14
44
San Diego · Public  Material decline
San Diego 537 1,941 23 80 29.2% 22.4% 19.6 4.5 428 125
45
San Diego · Private
San Diego 63 862 22 165 13.5% 17.5 104 14
46
San Diego · Public  Strong demand
San Diego 557 2,187 22 99 22.2% 30.9% 19.6 4.5 554 123
47
Chula Vista · Public  Holding share
San Diego 654 2,440 22 109 20.2% 30.6% 18.6 3.2 711 144
48
San Diego · Public  Material decline
San Diego 423 1,568 22 82 26.4% 37.0% 19.4 2.6 348 92
49
San Diego · Public  Demand hides churn
San Diego 294 1,318 21 78 27.6% 31.8% 20.1 7.1 228 63
50
Chula Vista · Public  Sharp downturn
San Diego 712 2,557 21 127 16.8% 32.9% 19.4 3.5 904 152
51
Chula Vista · Public  Material decline
San Diego 446 1,771 21 62 33.6% 32.3% 17.3 3.1 277 93
52
San Diego · Public  Material decline
San Diego 257 1,183 21 100 20.5% 28.3% 16.3 2.7 258 53
53
· Public  Material decline
San Diego 404 1,563 21 83 24.8% 27.7% 17.1 1.5 335 83
54
San Diego · Public  Demand hides churn
San Diego 377 1,591 20 73 27.9% 33.8% 18.0 2.6 276 77
55
Escondido · Public  Material decline
San Diego 450 1,846 20 75 26.0% 27.3% 15.3 2.4 338 88
56
· Public  Compounding decline
San Diego 501 1,864 19 69 27.9% 26.8% 17.8 3.4 347 97
57
Chula Vista · Public
San Diego 501 1,864 19 69 27.9% 26.8% 17.8 3.4 347 97
58
San Diego · Public  Weak at the gate
San Diego 83 359 19 140 13.8% 18.8% 13.2 4.8 116 16
59
San Diego · Public  Mid-year churn
San Diego 94 339 19 69 27.7% 16.7% 16.0 3.2 65 18
60
Escondido · Public  Both ends slipping
San Diego 465 1,788 19 67 28.4% 33.0% 14.6 2.6 310 88
61
Carlsbad · Public  Best in class
San Diego 408 1,774 19 92 20.5% 33.8% 15.7 3.2 376 77
62
· Public  Demand hides churn
San Diego 516 2,011 18 80 23.0% 36.8% 16.5 3.7 413 95
63
El Cajon · Public  Material decline
San Diego 464 1,728 17 69 25.4% 34.6% 14.9 3.5 319 81
64
Chula Vista · Public  Demand hides churn
San Diego 333 1,363 17 53 32.6% 21.1% 13.8 2.4 175 57
65
Vista · Public  Material decline
San Diego 495 1,949 16 65 24.4% 22.8% 13.3 1.4 324 79
66
Escondido · Public  Best in class
San Diego 248 932 16 78 20.2% 10.3% 12.1 1.2 193 39
67
San Diego · Public  Demand hides churn
San Diego 83 349 16 60 26.0% 30.8% 12.1 50 13
68
· Public  Material decline
San Diego 664 2,290 15 69 22.2% 34.6% 13.9 2.3 455 101
69
Spring Valley · Public  Best in class
San Diego 525 2,198 15 85 17.3% 31.2% 10.7 1.9 446 77
70
Santee · Public  Sharp downturn
San Diego 396 1,624 15 51 28.7% 31.0% 12.6 2.8 202 58
71
Imperial Beach · Public  Compounding decline
San Diego 290 1,216 14 66 21.9% 16.7% 12.1 1.0 192 42
72
San Diego · Private
San Diego 167 717 14 133 10.8% 12.5% 12.0 4.8 222 24
73
Escondido · Public  Best in class
San Diego 307 1,336 14 61 22.3% 21.4% 11.4 1.3 188 42
74
Oceanside · Public  Compounding decline
San Diego 454 1,948 13 61 21.1% 22.0% 11.2 2.0 279 59
75
Vista · Public  Material decline
San Diego 447 1,746 13 48 27.0% 25.9% 10.7 2.2 215 58
76
Escondido · Public  Compounding decline
San Diego 507 1,656 13 47 27.1% 24.6% 11.4 0.6 240 65
77
Lakeside · Public  Best in class
San Diego 501 1,810 13 53 24.0% 28.1% 9.0 2.0 267 64
78
El Cajon · Public  Compounding decline
San Diego 24 37 12 100 12.5% 24 3
79
· Public  Demand hides churn
San Diego 402 1,487 12 52 23.8% 32.0% 11.2 2.5 210 50
80
San Diego · Public  Mid-year churn
San Diego 208 823 12 65 18.4% 12.0% 9.1 1.4 136 25
81
Spring Valley · Public  Demand hides churn
San Diego 417 1,539 11 51 22.0% 21.3% 9.8 2.4 214 47
82
Lakeside · Public  Best in class
San Diego 36 164 11 17 66.7% 75.0% 6 4
83
San Diego · Public  Tracking
San Diego 76 360 11 103 10.3% 37.5% 10.5 78 8
84
Valley Center · Public  Weak at the gate
San Diego 266 1,075 11 45 23.1% 28.6% 7.5 121 28
85
Oceanside · Public  Sharp downturn
San Diego 623 2,463 10 54 19.5% 30.8% 8.5 0.8 334 65
86
La Mesa · Public  Tracking
San Diego 563 2,172 9 42 21.7% 31.4% 8.0 1.9 235 51
87
· Public  Strong demand
San Diego 635 2,331 9 57 15.5% 33.9% 7.4 1.3 362 56
88
Ramona · Public  Best in class
San Diego 328 1,404 9 39 21.9% 14.3% 5.8 128 28
89
· Public  Weak at the gate
San Diego 204 780 8 48 17.4% 41.2% 8.3 98 17
90
San Diego · Private
San Diego 37 436 8 86 9.4% 100.0% 8.1 32 3
91
· Public  Demand hides churn
San Diego 446 1,543 8 37 21.3% 34.3% 7.0 0.9 164 35
92
Santee · Public  Strong demand
San Diego 425 1,621 8 39 19.8% 27.3% 6.6 2.1 167 33
93
Bonsall · Public  Watch — engagement
San Diego 93 342 8 62 12.1% 4.3 58 7
94
El Cajon · Public  Mid-year churn
San Diego 440 1,701 8 35 21.3% 12.1% 7.5 1.8 155 33
95
San Diego · Private
San Diego 47 196 6 179 3.6% 84 3
96
· Public  Compounding decline
San Diego 63 226 5 60 7.9% 4.8 38 3
97
El Cajon · Private
San Diego 122 772 2 39 6.2% 2.5 48 3
98
San Diego · Public  Compounding decline
San Diego 179 1,375 2 26 8.7% 2.2 46 4
99
San Diego · Public
San Diego 33
100
Chula Vista · Public
San Diego 18.6% 59 11
UC Reach = top-6 UC admits ÷ senior class size. Where UCOP has not published unique-student totals, campus admits are summed — students admitted to more than one of the 6 campuses are counted at each, so values above 100 indicate strong students winning multiple competitive UC offers. See methodology →