San Diego Jewish Academy

San Diego · San Diego County · Religious-affiliated

Private San Diego County
Shareable scorecard →

Where grads go — and what it costs & pays

UC admits by campus · Class of 2025

UCSB
3 admitted
Net $16,109/yr avg
Grads earn $74,915 @10yr

Getting in is step one. The cost above is the average aid-receiving family's net price — yours depends on whether you qualify for aid — and your child's odds depend on their GPA + scores. See your family's real numbers at these campuses:

Get my child's odds + our real costs →

Sources: UC Office of the President (admits); IPEDS net price + College Scorecard 10-yr earnings (cost & payoff). Full campus-by-campus breakdown below.

You've seen San Diego Jewish Academy. What are your child's real college odds? Check any college in 10 seconds — no email needed — then get the free Family Decision Report: Reach / Competitive / Match / Likely + the real cost range for every college on their list. Check odds →

How San Diego Jewish Academy compares for families

What families should know about San Diego Jewish Academy.

  • vs Similar SchoolsThe closest comparables nearby: Cambridge School, Maranatha Christian Schools, Bishops School and 2 more. See the sidebar to compare side-by-side.

For Parents

Get alerts when San Diego Jewish Academy's numbers change

New admissions results, enrollment shifts, test scores — a few alerts a year, no spam. Your email also saves your list across devices.

Objective, government-grade data — no school pays us for placement.

Their published college acceptances

College acceptances

San Diego Jewish Academy publishes the colleges that admitted its graduates. What follows is copied from that document — 228 colleges, in the document's own order.

Years, as the document states them
last 5 graduating classes

Allegheny College American University Arizona State University (Downtown Phoenix) Arizona State University (Tempe) Babson College Bard College Barnard College Baylor University Bentley University Boise State University Boston College Boston University Bowdoin College Brandeis University Bryant University Butler University Cal Poly Humboldt California Institute of Technology California Institute of the Arts California Polytechnic State University (San Luis Obispo) California State Polytechnic University (Pomona) California State University (Bakersfield) California State University (Channel Islands) California State University (Chico) California State University (Fullerton) California State University (Long Beach) California State University (Los Angeles) California State University (Maritime Academy) California State University (Monterey Bay) California State University (Northridge)
and 198 more
California State University (Sacramento) California State University (San Marcos) Carleton University Carnegie Mellon University Case Western Reserve University Chapman University Claremont McKenna College Clark University Clemson University College of Charleston Colorado State University (Fort Collins) Columbia University Cumberland University DePaul University Drexel University Duke University Eckerd College Elon University Embry-Riddle Aeronautical University (Prescott) Emerson College Emmanuel College Emory University Fairfield University Fashion Institute of Design & Merchandising Fashion Institute of Technology Florida State University Fordham University Franklin & Marshall College George Washington University Georgetown University Georgia State University Harvard University Hastings College High Point University Hofstra University Hult International Business School (Boston) Hult International Business School (London) IE University Imperial College London Indiana University (Bloomington) John Cabot University Johnson & Wales University (Providence) King's College London Kingston University London Lafayette College Lake Forest College Les Roches University Lesley University Lewis & Clark College Linfield University Louisiana State University Loyola Marymount University Marist College Marymount Manhattan College Massachusetts Institute of Technology Menlo College Miami University (Oxford) Michigan State University MiraCosta College Muhlenberg College New Mexico State University (Main Campus) New York Institute of Technology New York University Northeastern University Northwestern University Occidental College Oregon State University Pace University (New York City) Palomar College Parsons School of Design at The New School Penn State University (Abington) Penn State University (University Park) Pitzer College Portland State University Pratt Institute Princeton University Purdue University (Main Campus) Queen Mary University of London Reed College Regis University Reichman University (IDC Herzliya) Rensselaer Polytechnic Institute Rhode Island College Roger Williams University Rollins College Rutgers University (New Brunswick) Rutgers University (Newark) San Diego Mesa College San Diego Miramar College San Diego State University San Francisco Conservatory of Music San Francisco State University San Jose State University Santa Clara University Savannah College of Art and Design School of the Art Institute of Chicago Scripps College Seattle University Simon Fraser University Sonoma State University South Dakota State University Southern California Institute of Architecture Southern Methodist University Southern Oregon University Southern Utah University Springfield College Stanford University Stonehill College Stony Brook University Suffolk University Syracuse University Temple University Texas A&M University Texas A&M University at Galveston Texas Christian University Texas Tech University The New School The Ohio State University The University of Tampa Towson University Tufts University Tulane University of Louisiana University at Albany University of Alaska Anchorage University of Arizona University of British Columbia University of California (Berkeley) University of California (Davis) University of California (Irvine) University of California (Los Angeles) University of California (Merced) University of California (Riverside) University of California (San Diego) University of California (Santa Barbara) University of California (Santa Cruz) University of Chicago University of Colorado Boulder University of Colorado Denver University of Connecticut University of Dayton University of Delaware University of Denver University of Florida University of Hawaii at Manoa University of Idaho University of Illinois at Chicago University of Illinois at Urbana-Champaign University of Iowa University of Kansas University of La Verne University of Maryland (Baltimore County) University of Maryland (College Park) University of Massachusetts (Amherst) University of Massachusetts (Boston) University of Miami University of Michigan University of North Carolina at Chapel Hill University of North Dakota University of Oregon University of Ottawa University of Pittsburgh (Bradford) University of Pittsburgh (Pittsburgh) University of Portland University of Puget Sound University of Redlands University of Rochester University of San Diego University of San Francisco University of Southern California University of the Pacific University of the Sciences University of Toronto University of Utah University of Vermont University of Victoria University of Virginia (Main Campus) University of Washington (Bothell Campus) University of Washington (Seattle Campus) University of Washington (Tacoma Campus) University of Wisconsin (Madison) Utah State University Utah Valley University Vassar College Virginia Polytechnic Institute and State University Wake Forest University Washington and Lee University Washington State University Washington University in St. Louis Wentworth Institute of Technology Western University Whitman College Whittier College Willamette University William & Mary Worcester Polytechnic Institute Yale University Yeshiva University York University

These graduates were admitted to the colleges above.

Check your kid's odds at these colleges →

We'll load 10 from the list above — add your name, email and your child's numbers and we'll see where your child lands at each.

Independently verified As published by San Diego Jewish Academy — Paving the Way to Success: SDJA Graduates Accepted at Top Colleges Nationwide ↗. Found at: PDF linked from the site's uploads folder.

No SBAC data for private schools — and that's not the metric you want anyway

California's Smarter Balanced (CAASPP) assessment is administered by the state, by statute, to public & charter schools only. Private schools don't sit for it. That's why the SBAC card is missing on this profile — not a data gap on our side, a deliberate scope of the state's testing program.

For private schools, UC Reach is the stronger academic signal anyway. SBAC measures grade-11 inputs (proficiency on a state standard); UC Reach measures outputs (who actually got into the most selective UCs). For private-school families weighing tuition against college outcomes, the outputs are the relevant signal.

This school doesn't have UC outcomes data on file yet — we surface UCOP-published admits by sending HS, and not every private school appears in those records. The enrollment trend, stability, and other cards on this page are still primary-sourced for this school.

Enrollment trend & projection

Total enrollment (9–12)
478 (2020)572 (2024)
+19.7%
Grade 12 (graduating class)
42 (2020)29 (2024)
-31.0%

If this trend holds (+5.0%/yr, Total enrollment)

At tuition of $ / student:

Horizon Projected Total enrollment Change Tuition impact / yr
1 yr (2025) ~601 +29 $0
3 yr (2027) ~662 +90 $0
5 yr (2029) ~730 +158 $0

Straight-line extrapolation of the recent annual rate — a what-if, not a forecast of intent. Default = derived from this school's IRS Form 990 (FY2023) — program-service revenue ÷ enrollment. Edit the figure to match your school.

How does San Diego Jewish Academy really compare on getting kids to college?

We've ranked it #9 of 9 most similar nearby schools on UC Reach. Unlock the full snapshot to see the head-to-head — who's ahead, by how much, and where it's heading.

The full head-to-head table — every peer school's UC Reach, side by side.
Enrollment trend + 3-year projection — is this school growing or quietly shrinking?
The plain-English read on what it all means for your family.

Your similar-school group includes

Cambridge School · Maranatha Christian Schools · Bishops School · Horizon Prep · Santa Fe Christian School · Academy Our Lady of Peace · +4 more

Objective, government-grade data — no school pays us for placement. We'll email you the snapshot and a few alerts a year. Unsubscribe anytime.

Financial profile — IRS Form 990, FY2023

From 13 years of Form 990 filings via ProPublica Nonprofit Explorer (free public IRS data). The school's tax filings show financial scale, fundraising health, and endowment trajectory — signals that drive board-level conversations about tuition pricing, financial-aid capacity, and capital projects.

Total revenue
$27.1M
FY2023
Net assets (endowment + property)
$44.9M
+15.4% since FY2011
Tuition revenue (program)
$21.5M
≈ $37589/student avg
Gifts & grants
$4.9M
fundraising
Total revenue by year ($M)
Net assets by year ($M)

Source: IRS Form 990 via ProPublica Nonprofit Explorer (EIN 953287745). View latest 990 PDF → Tuition-per-student is total program-service revenue divided by latest enrollment — a rough average that includes auxiliary revenue (athletics, food service, etc.); the actual published tuition can differ. Form 990 is filed annually under penalty of perjury, so the financial scale figures are authoritative.

UC Reach Score methodology
UC Application Reach Score
N/A
79 applications
UC Admit Rate
3.8%
3 / 79 applications
In context: CA median 26.0% · Top 10% statewide ≥ 40.4% · higher than 0% of CA HS.
UC Yield Rate
N/A
— enrolled of 3 admitted
Yield vs. Enrollment Reach: Yield answers "of UC admits, what % chose UC?" — denominator is just the admits. A small admitted cohort can post a low yield even when the school sends a healthy share of its class to UC.
UC Enrollment Reach Score
N/A
— enrollees / — seniors
Enrollment Reach vs. Yield: Reach answers "of the whole senior class, what share ended up at UC?" — denominator is everyone. High Yield with low Enrollment Reach is common at elite privates: most admits matriculate, but the school sends most of its class to non-UC selective colleges.
Selective UC Reach (UCB, UCLA, UCSD, UCSB, UCI — incl. the Elite two)
N/A
Elite UC Reach (UCB + UCLA)
N/A
Senior Class Size
N/A
Run CDE download to enable the Reach Score
Total School Enrollment
N/A
All grades · Private School Affidavit

Private-school figures come from the California Private School Affidavit. Per CDE, inclusion in private-school data is not an evaluation, approval, or endorsement of a school.

Avg. Applicant GPA · top-6 UCs
3.80

GPA figures reflect 2024 — UC has not yet released applicant/admit GPA for 2025.

UC funnel — which kids are getting in at what GPA

Combining the school's applicant pool GPA, admit pool GPA, actual admit rate, and statewide CA admit rates by individual GPA band, we can read which GPA tiers tend to get in — and which don't.

Who's actually getting into UC from San Diego Jewish Academy
Campus 4.00+ GPA 3.70–3.99 GPA 3.30–3.69 GPA < 3.30 GPA
UC San Diego Strong shot Real shot Long odds Filtered out
UC Santa Barbara Strong shot Moderate Long odds Filtered out
UC Irvine Strong shot Real shot Long odds Filtered out
UC Davis Strong shot Real shot Moderate Filtered out
Strong shot = ≥30% statewide admit rate at this band · Real shot = 10–29% · Moderate = 5–9% · Long odds = 1–4% · Filtered out = under 1%. Tiers map this school's likely outcomes by GPA tier using statewide CA admit rates from UCOP 2024.

The numbers behind it

Campus Applicant GPA Admit GPA Lift Admit rate vs peer schools @ same GPA
UC San Diego (2021) 3.82 4.11 +0.29 37.5% Peers +0.37 · wider
UC Santa Barbara (2023) 4.00 4.22 +0.22 25.0% Peers +0.25 · matches
UC Irvine (2023) 4.01 4.07 +0.06 35.7% Peers +0.21 · wider
UC Davis (2023) 4.01 4.10 +0.09 76.5% Peers +0.21 · wider
Statewide CA admit rates by individual GPA band, 2024 (for reference)
GPA band UCB UCLA UCSD UCSB UCI UCD
4.00+ 17.1% 14.4% 43.5% 57.3% 46.0% 64.1%
3.70–3.99 2.8% 1.5% 11.2% 9.2% 16.5% 27.5%
3.30–3.69 0.8% 0.9% 1.4% 2.3% 3.4% 9.1%
3.00–3.29 0.5% 0.4% 0.1% 0.5% 0.4% 2.1%
< 3.00 0.6% 0.2% 0.2% 0.5% 0.3% 0.6%
How we infer the tier labels: Each tier comes from the statewide CA admit rate at that GPA band at that UC. The "vs peers" column compares this school's lift (admit GPA − applicant GPA) to the average lift at ~100–300 other CA schools with similar applicant pool GPA. What this isn't: a guarantee. UC comprehensive review weighs essays, course rigor, demographics, and context-of-opportunity beyond GPA. A 3.9 with strong context can land an admit; a 4.0 with weak essays can be denied. Use as a baseline expectation, not a verdict. Per-campus year is shown when it differs from the headline year (UCOP doesn't always publish admit-GPA for every campus every year).

UC Outcomes Trend — 2018–2025

UC Admit Rate %
UC Reach Score (where available)
UC Admits (count, right axis)

Class size from CDE grade 12 enrollment. Campus-level data: applicant and admit totals count a student once at EACH campus. A senior admitted to UCLA and UC San Diego adds 2 to the admit total, so the total can exceed the senior class — that is the metric working as defined, not an error. The admit RATE is unaffected: both its numerator and denominator are campus-level.

Campus Breakdown — 2025

Campus Applicants Admits Enrollees Admit Rate UC Reach Score Yield Avg GPA (App) '24 Avg GPA (Adm) '24
UC Berkeley → Elite 8
UCLA → Elite 17 3.91
UC San Diego → Selective 14 3.73
UC Santa Barbara → Selective 17 3 17.6% 3.83
UC Irvine → Selective 13 3.65
UC Davis → 10 3.76
= UCOP-suppressed (count below 3 students, hidden for privacy — actual value is 0, 1, or 2, not necessarily zero). Campus-level totals may count one student admitted to multiple UC campuses more than once; Admit Volume metrics are not the same as UC Reach, which is measured against the whole senior class. See methodology →

What This Means

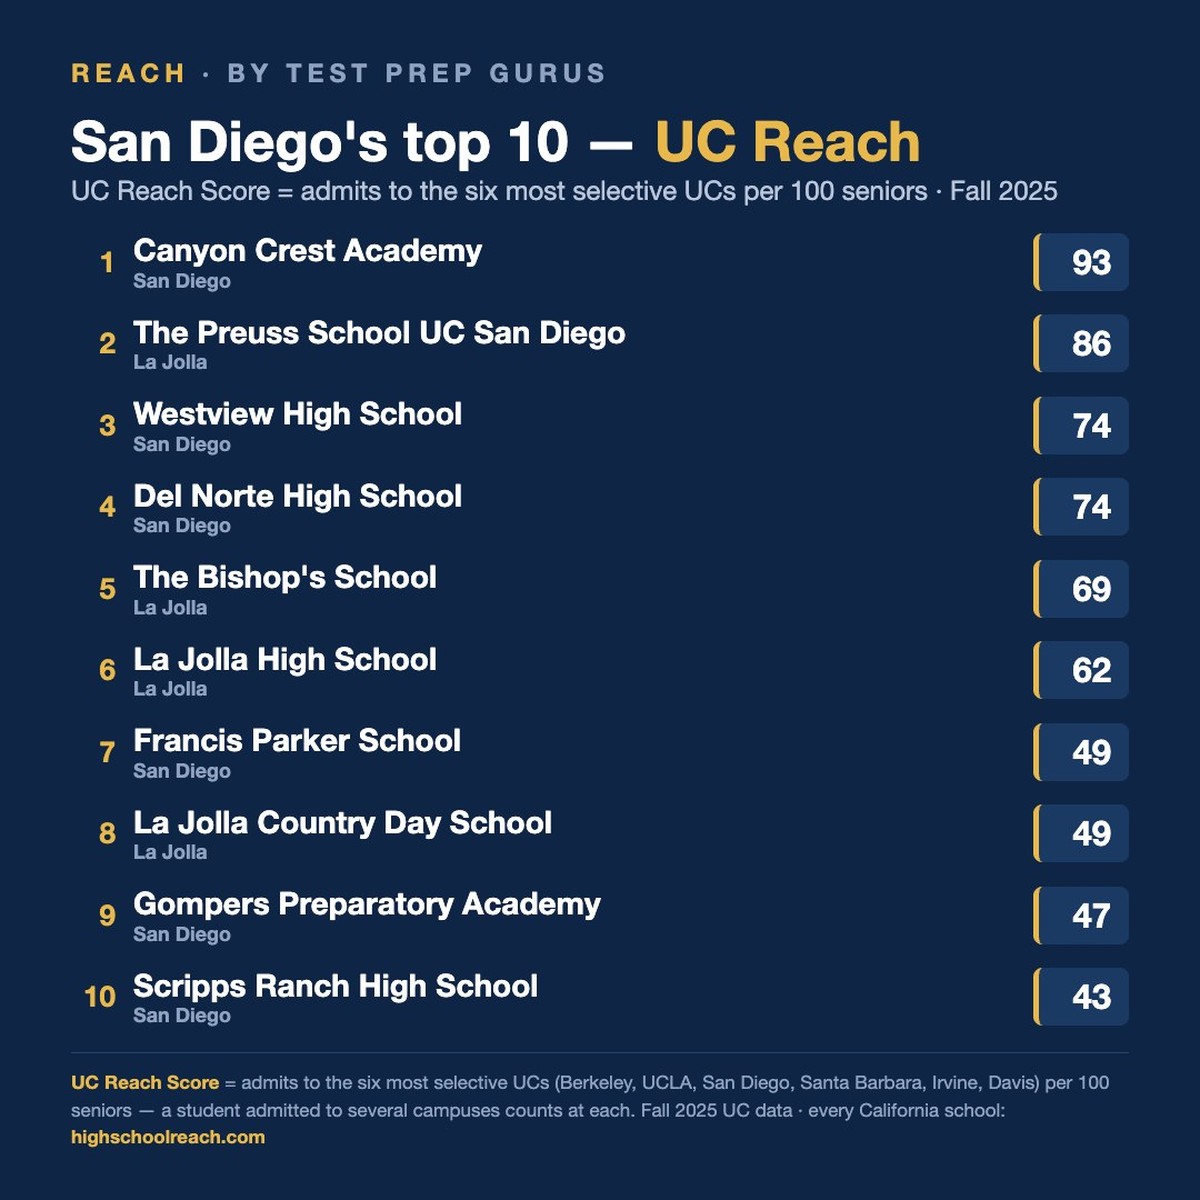
Note: the UC Reach Score sums campus-level admits across the top-six UC campuses, so a student admitted to both UCLA and UCSD is counted at each. It reflects competitive admit volume relative to class size — admit-events, not distinct students — which is why a Score can exceed 100.
Senior class size is estimated from CDE grade 12 enrollment data. Reach percentages should be interpreted as approximate.
Compare with other schools → See San Diego County rankings →

For Parents

Researching colleges for your kid at San Diego Jewish Academy?

Check any college's odds in 10 seconds — no email needed — then get the free Family Decision Report: Reach / Competitive / Match / Likely with real admit odds and your real net price, for every college on their list.

Check your child's odds →

For School Admins looking at enrollment trends: request a Reach Report →

What are your child's odds? →

What families ask next