A parent's read

  • The major moves the money more than the admit letter. Management Sciences and Quantitative Methods grads from here earn about $158,559 four years out; dance grads about $38,571 — a 4.1× spread on the same diploma. Have the major conversation before you deposit, not after.
  • Built for the AI economy. Top 12 in the country. About 1 in 13 degrees here is already in AI, computer science, or data fields; its AI research output ranks #12 among US universities. This campus is leaning into the shift, not waiting for it.
  • There is merit money here, but you compete for it. Every named award at this college is competitive — the published GPA and score figures describe who tends to win them, not a bar that guarantees anything. Worth applying for; not worth counting on when you budget.
  • Almost everyone who starts here finishes. 88% graduate within six years — the standard federal measure. Nationally about a third of students who start a bachelor's never finish one, and an unfinished degree is the most expensive outcome in this decision: the debt stays, the credential doesn't.
  • Your price depends enormously on whether you qualify for aid. Families who receive aid average about $37,050/yr here; without aid it's the full ~$84,374/yr. There's no income cutoff for aid — qualifying depends on the gap between this college's price and your finances, which is why the college's own net-price calculator — not any average — is the estimate to trust.

Composed from this page's data — every claim is backed by a number in the sections below.

Get your child's odds at New York University Free Family Decision Report — Reach / Competitive / Match / Likely + your real net price. New York University starts already on the list. Start →
Odds at New York University

Put in your child's GPA and score — we'll show where they land here. Free, and nothing to sign up for.

Most families report the weighted one — it's the higher number, with honors and AP credit in it.

This reads the numbers — admit rate, scores, GPA. The real decision also weighs essays, recommendations, activities, and course rigor.

Get their full list — free Family Decision Report →

The free report adds every college on your list — Reach / Competitive / Match / Likely odds, your real net price, and merit-scholarship eligibility. About a minute.

Live odds from each college's own published admissions data.

Parent/student verdict

Highly selective

Highly selective reach for nearly every applicant.

Best for

  • Strong academic profiles — students here cluster in the top test and GPA tiers (bands above)
  • Strong test/GPA students chasing merit aid — AnBryce Scholarship or Stamps Scholars Program at NYU on offer (see merit-scholarship tab below)
  • Students drawn to Visual & Performing Arts or Social Sciences (the two biggest majors)
  • Research-oriented students (R1 — top tier of federal research funding)
  • Students who thrive in a large, programmatic environment

The reality

  • You'd be near the bottom of their admitted class if: SAT below 1480, or ACT below 33, or unweighted GPA below 3.61 (test bands are the school's own; the 3.61 line is our estimate, not a published figure)
  • With selective universities, build a balanced college list of Reaches, Targets, and Safeties
  • High cost — full price is ~$84,374/yr without aid, and aid-receiving families still average ~$37,050/yr — verify the major's earnings track record before committing

Verdict is composed from this college's structured data (admit rate, SAT bands, net price with aid and at full price, Carnegie classification, scholarship grids) using transparent rule thresholds — not a chat-bot's opinion.

What are your child's odds here?

Enter their numbers once — this and every college page shows their verdict, and the UC campus cards on California school pages light up with it too. Free, no email.

Weighted is the higher GPA, with honors/AP credit in it — pick whichever your school reports. PSAT scores work in the SAT box.

Institutional snapshot

What kind of college is this?

Carnegie classification
R1: Doctoral - Very High Research Activity
Undergraduates
28,663
20,000 and above including graduate students
TuitionThe published full price before any aid. Families who don't qualify for need-based aid at a given college pay this, minus any merit scholarships — whether you qualify depends on the college's price and policies, not on any fixed income line.
$62,796
flat rate (no in/out-of-state split) · 2023–24 federal figure
Admit rateThe share of applicants a college accepts. Useful context, but your student's odds depend on their own grades and scores, not the average.
9.4%
Hyper-selective
SAT middle 50%The middle half of the enrolled first-years who sent this test scored in this range — a quarter of them scored BELOW the low end and still got in, and a quarter scored above the high end. At a test-optional college the students who submitted are often a minority of the class, so the range describes them rather than everyone who enrolled. Above the top number is a genuine strength; below the bottom isn't automatic rejection.
1480–1570
EBRW + Math composite
ACT middle 50%The middle half of the enrolled first-years who sent this test scored in this range — a quarter of them scored BELOW the low end and still got in, and a quarter scored above the high end. At a test-optional college the students who submitted are often a minority of the class, so the range describes them rather than everyone who enrolled. Above the top number is a genuine strength; below the bottom isn't automatic rejection.
33–35
composite
Test policyApplicants choose whether to send SAT/ACT scores. At many such colleges, students who submit strong scores are still admitted at higher rates.
Test-optional
2023
10-yr earningsMedian yearly pay of former students ten years after they STARTED here — not ten years after graduating — all majors combined. The broadest single outcome number a college reports.
$82,509
median, after entry

27% of enrolled first-years submitted an SAT score, 12% an ACT — these ranges describe students who submitted, not the whole class.

Source: federal IPEDS Admissions 2023 for scores + admit rate; federal College Scorecard (20260606 vintage) for earnings + outcomes. SAT/ACT bands are the 25th–75th percentile of enrolled submitters.

High-school GPA

3.81 avg unweightedGPA on the plain 4.0 scale, no honors/AP bonus. When a college publishes an "average admitted GPA of 3.9," it's often this scale — don't compare it to a weighted 4.3. GPA, enrolled first-years

Enrolled first-years by GPA band: 4.00 18% · 3.75-3.99 54% · 3.50-3.74 22% · 3.25-3.49 5% · 3.00-3.24 1%

unweighted 4.0 scale. New York University Common Data Set 2024-2025, Section C9-C12 (First-time, first-year Profile; official NYU Office of Institutional Research PDF, accessed via Internet Archive snapshot 2025-06-10) ↗

As published by the college in its Common Data Set / admissions data (2024-25) (source linked above). GPA basis (weighted vs. unweighted vs. 4.0-scale) varies by college and is labeled above.

Outcomes & cost

What graduates actually earn, finish, and owe.

Federal College Scorecard data. Earnings are median annual income measured years after entering. Debt is for federal-aid borrowers only (cash-pay students aren't counted).

Earnings, 6 yrs after entry
$64,543
Earnings, 10 yrs after entryMedian yearly pay of former students ten years after they STARTED here — not ten years after graduating — all majors combined. The broadest single outcome number a college reports.
$82,509
Graduate within 6 yrsThe share of students who start here and finish a bachelor's within six years — the standard federal measure, and the one College Scorecard publishes. It is not a four-year rate. Read it as the odds of finishing at all: nationally about a third of students who start never do, and an unfinished degree is the most expensive outcome in this decision.
88%
Median debt (completers)The federal-loan balance of the typical graduating borrower. Families who pay cash aren't counted, so read it as "among those who borrowed."
$20,500

The real cost

What New York University actually costs

If you qualify for need aidGrant money based on your family's finances (via FAFSA and the college's own forms), not your student's stats.
$37,050/yr
average among aid-receiving families, all incomes — your number depends on your finances
If you don't
$84,374/yr
the full published price

Which side your family lands on isn't set by any national income line — it's set by New York University's own aid decision: the gap between its price and your family's finances.

New York University's own published aid policy · last published for 2024-25

The most recent policy we verified covered tuition for families under $100,000, and committed to meeting 100% of demonstrated need. Thresholds change most years, so treat this as history, not a promise — confirm the current policy with the college or run its calculator below.

Beginning in the 2024-25 academic year, President Linda G. Mills expanded NYU's commitment to affordability through The NYU Promise, guaranteeing that every undergraduate–domestic and international–who start as a first-year student admitted to our New York campus will have 100% of their demonstrated need met through a combination of scholarships and grants. In addition, families with income less than $100,000 and who hold typical assets will not have to pay tuition. ... Meeting demonstrated need means NYU will cover, through institutional scholarships, federal/state grants, and expected student work, the cost of attendance–including tuition, housing, food, books, and supplies–less the amount that your family is expected to contribute as determined by the information provided on the CSS Profile. ... Loans are not included in your financial aid package to meet your demonstrated need, however, federal loans are offered with submission of the FAFSA and private loans are an option to assist with your family contribution.

Income thresholds assume typical assets — and this college uses the CSS Profile, which can count home equity and business value the federal form ignores. Policy independently verified against the college's financial-aid pages ↗.

Get your family's number — New York University's Net Price Calculator ↗ 10–15 minutes; have a tax return handy. It's still an estimate — but it's this college's own, built from your family's numbers, not anyone's average.
Start your Family Decision Report →

Your odds + estimated cost across your whole college list, side by side.

The payoffTen years of typical graduate pay minus four years of cost — how many dollars ahead a typical graduate runs by year ten. Check both the full-price and with-aid versions to see which applies to you; median pay reflects who a college admits and what they study as much as the college itself., both ways

+$488K ahead at full price +$677K with aid
Full price, no aidThe all-in yearly price — tuition, housing, food, books, fees — before any aid. This is the real "full price," not just the tuition line. (4 yrs)
$337,496
~$84,374/yr all-in
Aid recipients pay (4 yrs)
$148,200
$37,050/yr average
10-yr earnings total
$825,090
$82,509/yr median, 10 yrs out
Years to recoup the cost
4.1 yrs
at full price (1.8 with aid), at the median earnings rate

Source: College Scorecard (average net price among Title IV first-time, full-time undergraduates who received aid) and each college's published cost of attendance. We don't show the federal net-price-by-income brackets: their categories were fixed in 2008 and never adjusted, and none of the averages is your family's own number — the full story. Payoff = (10-yr median earnings × 10) − (4 years of cost), in dollars — how far ahead a typical graduate runs by year ten; medians travel with the students a college admits and the majors they choose as much as with the college itself. Full price is the published cost of attendance; earnings are 10 years after enrollment, all majors combined.

What students study here

Most popular majors at New York University

Top 5 fields of study by bachelor's degrees awarded (most recent IPEDS Completions). Use this to see what New York University actually graduates — not just what it markets.

1. Visual & Performing Arts
1,160 degrees · 28.3%
Highly variable. Steady-pay roles cluster in design, illustration, production. Performance careers have very wide income distributions.
2. Social Sciences
949 degrees · 23.2%
Economics + poli sci sub-disciplines pay much more than sociology + anthropology.
3. Business, Management, & Marketing
864 degrees · 21.1%
Broad set of corporate roles. Finance + consulting pay top, accounting + HR pay middle, sales spread is wide.
4. Computer & Information Sciences
586 degrees · 14.3%
High-paying tech roles dominate. Median software roles cluster in the $90k-$130k range.
5. Liberal Arts, Humanities, & General Studies
535 degrees · 13.1%
Flexible degree → many paths. Real outcomes depend on the second skill (data, coding, teaching cert).

What those majors earn here

Median earnings 4 years after entry, by major — New York University's own graduates, not national averages.

Major (CIP) Credential Cohort 1-yr earnings 4-yr earnings
Management Sciences and Quantitative Methods. Bachelor's Degree 255 $102,572 $158,559
Computer and Information Sciences, General. Bachelor's Degree 604 $87,608 $142,495
Business/Commerce, General. Bachelor's Degree 395 $77,828 $137,804
Real Estate. Bachelor's Degree 58 $74,912 $130,716
Mathematics and Statistics, Other. Bachelor's Degree 108 $80,154 $129,073
Computer Engineering. Bachelor's Degree 38 $82,183 $127,201
Registered Nursing, Nursing Administration, Nursing Research and Clinical Nursing. Bachelor's Degree 431 $111,360 $118,433
Economics. Bachelor's Degree 541 $68,495 $116,510
Engineering-Related Fields. Bachelor's Degree 69 $61,240 $114,572
Electrical, Electronics, and Communications Engineering. Bachelor's Degree 42 $74,220 $107,348

Sources: IPEDS Completions (C2023_a; bachelor's-level first majors, 2-digit CIP family — share is of the top 5 only) · College Scorecard program-level outcomes (PP-FOS). Full college-vs-major comparison: /college-outcomes →

Merit aidScholarship money awarded for grades or test scores, not financial need — at many colleges it's automatic at certain GPA/score levels.

What your test score unlocks at New York University

Score-or-merit-based scholarships published by the institution. Stackable in most cases — confirm with the financial aid office.

Award Annual award Score gate GPA gate Renewable
AnBryce Scholarship
AnBryce (full tuition) · any
$62,000/yr
as published, checked 2026-06-06 · source ↗
Yes
Stamps Scholars Program at NYU
Stamps (enrichment funding) · any
Stipends for experiential learning (study abroad, research, internships, conferences, leadership training) Yes

See all merit scholarships across colleges + 13 national awards on /merit-scholarships →

See which merit tiers your child already clears — free Family Decision Report Start →

Student body & economic mobility

Who attends here — and what the campus adds.

Opportunity Insights data. It measures two things at once: how many lower-income students a college enrols, and how many of them reach the top earnings quintile later. A high rate says the college does both — it does not establish that the campus caused the earnings, because the students it admits differ from the students it doesn't. Read it as a signal about access and destination, not as proof of value added.

Top-1% access
8.8%
from top-1% households
Mobility rateThe share of ALL students who arrived from the bottom 20% of family incomes AND reached the top 20% themselves by their early 30s — access and lift in one number, and a sign the campus itself adds earnings power.
3.6%
bottom 20% → top 20% by age 32
Upward rate
52.3%
of lower-income students who reach the top 20%
Pell recipientsStudents receiving federal Pell grants, which go to lower- and middle-income families — the standard shorthand for a college's economic mix.
18%
on federal need grants — context for these numbers

Full leaderboards: /college-mobility →

Alternatives to New York University

Matched not just by selectivity, but by strategic goal — what a family actually decides on.

Better merit-aid options
These similar-selectivity schools publish merit scholarships your family can plan around — your kid’s stats could unlock real scholarship dollars.
University of Chicago
IL · Private nonprofit
1 stats-based + 1 competitive scholarships
University of Southern California
CA · Private nonprofit
5 competitive merit scholarships
Vanderbilt University
TN · Private nonprofit
4 competitive merit scholarships
Lower full price
Similar selectivity, but a meaningfully lower full sticker price — the comparison that matters most for families who won't qualify for much need-based aid.
CUNY Hunter College
NY · Public
$13,905/yr full price (in-state) · $70,469 less before aid for NY residents
CUNY City College
NY · Public
$14,403/yr full price (in-state) · $69,971 less before aid for NY residents
University of Florida
FL · Public
$22,523/yr full price (in-state) · $61,851 less before aid for FL residents
Safer in-state options
Same state and similar selectivity, but with a more forgiving admit rate — useful safety / match anchors.
Binghamton University
NY · Public
38% admit rate (vs 9% here)
Stony Brook University
NY · Public
49% admit rate (vs 9% here)
CUNY Hunter College
NY · Public
54% admit rate (vs 9% here)
More students move up here
Per Opportunity Insights, a larger share of these campuses' lower-income students reach the top earnings quintile than at New York University. That reflects who they admit as well as what they do, so read it as a destination signal rather than proof of value added.
CUNY City College
NY · Public
11.7% mobility rate (vs 3.6% here)
Stony Brook University
NY · Public
8.4% mobility rate (vs 3.6% here)
CUNY Hunter College
NY · Public
7.5% mobility rate (vs 3.6% here)

Or compare any college side-by-side

Deciding on New York University?

Get the full picture in one free report — your child's Reach / Competitive / Match / Likely odds and your real net price, for New York University and every other college on your list.

Get your child's odds at New York University →

Score-odds calculator · Improve the score first

Feeder high schools

Which high schools send graduates to New York University?

Enrolled — from the schools' matriculation lists

185 high schools publish a numbered matriculation list — where their graduates actually enrolled, counted, in the school's own School Profile — and name New York University on it. Between them they printed 1418 enrolled graduates. Ranked by graduates per class year enrolling at New York University, from each school's own published list: the number that school printed, divided by the class years its list covers. The published total and the school's own years label are shown beside every school, so a one-year list and a five-year list can sit on the same page. A list whose class years we cannot read is not divided by a guess — it is listed below with its total instead.

High school · years its list covers Enrolled per class year
Harvard-Westlake School · BY THE CLASSES OF 2021-2025 · counted column: CLASS OF '25 26.0 · 26 over 1 class year
Choate Rosemary Hall · Class of 2021-2025 As published 10.8 · 54 over 5 class years
Crossroads School · classes of 2023-25 As published 9.7 · 29 over 3 class years
Dwight-Englewood School · Class of 2026 9.0 · 9 over 1 class year
Orange County School of the Arts · Class of 2026 9.0 · 9 over 1 class year
Harker School · Classes of 2023, 2024 & 2025 8.7 · 26 over 3 class years
Sage Hill School · 2023-2025 8.3 · 25 over 3 class years
Ransom Everglades School · Classes of 2020-24 As published 8.2 · 41 over 5 class years
Northfield Mount Hermon · the past four years 8.0 · 32 over 4 class years
Avenues New York · CLASSES OF 2023–2026 · counted column: CLASS OF 2026 8.0 · 8 over 1 class year
and 173 more
Princeton Day School · Class of 2026 8.0 · 8 over 1 class year
Suffield Academy · Class of 2025 8.0 · 8 over 1 class year
Horace Mann School · Class of 2024 - 2026 Graduates 7.3 · 22 over 3 class years
The Lawrenceville School · the last five years 7.2 · 36 over 5 class years
Emma Willard School · Classes of 2023, 2024, 2025, 2026 7.0 · 28 over 4 class years
Marlborough School · Class of 2025 6.0 · 6 over 1 class year
Kent School · College Matriculations 2023-2025 5.7 · 17 over 3 class years
Lycee Francais De New York · Class of 2022-2025 5.2 · 21 over 4 class years
Blair Academy · Class of 2026 5.0 · 5 over 1 class year
Bullis School · Class of 2026 5.0 · 5 over 1 class year
Hopkins School · Class of 2026 5.0 · 5 over 1 class year
Millbrook School · Class of 2026 5.0 · 5 over 1 class year
Santa Margarita Catholic High School · Class of 2025 5.0 · 5 over 1 class year
Stevenson School - Pebble Beach Campus · Class of 2025 5.0 · 5 over 1 class year
The International School of San Francisco · Class of 2026 5.0 · 5 over 1 class year
The Webb Schools · Class of 2024 5.0 · 5 over 1 class year
Tower Hill School · Class of 2026 5.0 · 5 over 1 class year
The Stony Brook School · Classes of 2021-2025 4.8 · 24 over 5 class years
Punahou School · the past four years (2022 – 2025) As published 4.8 · 19 over 4 class years
Newark Academy · 2023-2026 4.5 · 18 over 4 class years
Pine Crest School · 2022-26 4.4 · 22 over 5 class years
The Hockaday School · 2024 – 2026 4.3 · 13 over 3 class years
Berkeley Preparatory School · Class of 2026 4.0 · 4 over 1 class year
Stevenson School · Class of 2024 As published 4.0 · 4 over 1 class year
The Madeira School · Class of 2026 4.0 · 4 over 1 class year
Poly Prep Country Day School · Classes of 2020–2024 3.8 · 19 over 5 class years
Lake Forest Academy · 2021 - 2024 As published 3.8 · 15 over 4 class years
Portledge School · Classes of 2022–2026 3.6 · 18 over 5 class years
Ethical Culture Fieldston School · Classes of 2022–2026 3.4 · 17 over 5 class years
Saddle River Day School · 2020-2024 3.4 · 17 over 5 class years
St. Stephen's Episcopal School (Austin) · Classes of 2021-2025 3.4 · 17 over 5 class years
The Westminster Schools · Classes 2021-2025 3.4 · 17 over 5 class years
Westminster · Classes 2021-2025 3.4 · 17 over 5 class years
La Jolla Country Day School · 2023-2025 3.3 · 10 over 3 class years
Polytechnic School · Class of 2022-2026 3.2 · 16 over 5 class years
Loyola High School · 2020-24 3.0 · 15 over 5 class years
Lick Wilmerding High School · past four years 3.0 · 12 over 4 class years
University of Chicago Laboratory Schools · past four years 3.0 · 12 over 4 class years
St. Paul's School (NH) · College Matriculation for the Forms of 2025 and 2026 (combined two-year TOTAL column) 3.0 · 6 over 2 class years
Valley Christian High School · Class of 2024 & 2025 3.0 · 6 over 2 class years
Archer School for Girls · Class of '25 3.0 · 3 over 1 class year
Avenues The World School · Class of 2024 3.0 · 3 over 1 class year
Dana Hall School · Class of 2026 3.0 · 3 over 1 class year
McDonogh School · Class of 2026 3.0 · 3 over 1 class year
Virginia Episcopal School · Class of 2024 3.0 · 3 over 1 class year
Western Reserve Academy · Class of 2026 3.0 · 3 over 1 class year
Albuquerque Academy · Classes of 2021-2024 2.8 · 11 over 4 class years
Francis Parker School · 2022-2025 2.8 · 11 over 4 class years
Greenhill School · 2022 - 2025 2.8 · 11 over 4 class years
Marin Academy · CLASSES OF 2023–2025 2.7 · 8 over 3 class years
Milton Academy · 2024-2026 2.7 · 8 over 3 class years
Head-Royce School · (2021–25) 2.6 · 13 over 5 class years
Holton-Arms School · College Matriculations 2017-2020 2.5 · 10 over 4 class years
Loyola School · 2023-2026 2.5 · 10 over 4 class years
The Hotchkiss School · Classes of 2023, 2024, 2025, and 2026 2.5 · 10 over 4 class years
Concord Academy · 2021 to 2025 2.4 · 12 over 5 class years
Packer Collegiate Institute · 2021 - 2025 2.4 · 12 over 5 class years
San Francisco University High School · 2021-2025 2.4 · 12 over 5 class years
Cate School · 2019-2023 As published 2.2 · 11 over 5 class years
Lakeside School · 2021-2025 2.2 · 11 over 5 class years
The Northwest School · classes of 2021-2025 2.2 · 11 over 5 class years
Friends Central School · 2019-2023 2.0 · 10 over 5 class years
Germantown Academy · Classes of 2022-2026 2.0 · 10 over 5 class years
The Blake School · Classes 2021-2025 2.0 · 10 over 5 class years
The Cambridge School Of Weston · Classes of 2022-2026 2.0 · 10 over 5 class years
The Potomac School · past four years 2.0 · 8 over 4 class years
Menlo School · Classes of 2023-2025 As published 2.0 · 6 over 3 class years
St. Mark's School of Texas · Classes of 2023-2025 2.0 · 6 over 3 class years
Cape Henry Collegiate School · Class of 2025 2.0 · 2 over 1 class year
Middlesex School · Class of 2026 2.0 · 2 over 1 class year
Paideia School · Class of 2026 2.0 · 2 over 1 class year
Providence Day School · Class of 2026 2.0 · 2 over 1 class year
St. Luke's School (New Canaan) · Class of 2026 / Classes 2021-2025 · counted column: Class of 2026 2.0 · 2 over 1 class year
The Williston Northampton School · Class of 2026 / Classes of 2022-2025 · counted column: Class of 2026 Matriculation List 2.0 · 2 over 1 class year
Albany Academies · 2022-2026 1.8 · 9 over 5 class years
Beaver Country Day School · Five Year Summary 2022-2026 1.8 · 9 over 5 class years
Convent of the Sacred Heart · 2022-2026 1.8 · 9 over 5 class years
Moravian Academy · the last five years 1.8 · 9 over 5 class years
Noble and Greenough School · 2021–2025 1.8 · 9 over 5 class years
The John Cooper School · Class of 2022 - 2026 1.8 · 9 over 5 class years
Bentley School · College Matriculations 2022–2025 1.8 · 7 over 4 class years
Winsor School · 2022–2025 1.8 · 7 over 4 class years
Dalton School · 2019-2024 1.7 · 10 over 6 class years
Germantown Friends School · 2023-25 1.7 · 5 over 3 class years
Westridge School · 2021-2023 1.7 · 5 over 3 class years
Charles Wright Academy · Class of 2021-2025 1.6 · 8 over 5 class years
Marymount School of New York · 2020-2024 1.6 · 8 over 5 class years
St. George's School · Classes of 2022-2026 As published 1.6 · 8 over 5 class years
Francis W. Parker School · Classes of 2022-2025 1.5 · 6 over 4 class years
Wheeler School · College Matriculation for the Classes of 2022-25 1.5 · 6 over 4 class years
Durham Academy · 2021–2025 1.4 · 7 over 5 class years
Eastside Preparatory School · 2021-2025 1.4 · 7 over 5 class years
Episcopal High School · Classes of 2022 through 2026 1.4 · 7 over 5 class years
Friends Seminary · The Classes of 2021–2025 1.4 · 7 over 5 class years
Thomas Jefferson School · 2021 - 2025 As published 1.4 · 7 over 5 class years
Westtown School · 2022-2026 1.4 · 7 over 5 class years
The Bush School · 2020-2025 1.3 · 8 over 6 class years
Riverdale Country School · Higher Ed Enrollment 2021-2026 1.2 · 7 over 6 class years
Greens Farms Academy · Class of 2022-2026 1.2 · 6 over 5 class years
Greenwich Academy · 2022-2026 1.2 · 6 over 5 class years
John Burroughs School · 2021-2025 1.2 · 6 over 5 class years
Laurel School · 2021-2025 1.2 · 6 over 5 class years
Moorestown Friends School · Classes of 2021-2025 1.2 · 6 over 5 class years
The Brearley School · 2022–2026 1.2 · 6 over 5 class years
Trinity Hall · Classes of 2022-2026 1.2 · 6 over 5 class years
Catlin Gabel School · last four years 1.2 · 5 over 4 class years
Landon School · College Admittance 2023-2026 1.2 · 5 over 4 class years
Washington International School · 2022–2025 1.2 · 5 over 4 class years
Kamehameha Schools · the last seven years, 2017-2023 1.0 · 7 over 7 class years
York School · Classes of 2021-2026 1.0 · 6 over 6 class years
Collegiate School · 2022-2026 1.0 · 5 over 5 class years
Hathaway Brown School · 2022 - 2026 1.0 · 5 over 5 class years
Lancaster Country Day School · 2020-2024 1.0 · 5 over 5 class years
Pingree School · 2021–2025 1.0 · 5 over 5 class years
Santa Catalina School · Classes of 2021-2025 1.0 · 5 over 5 class years
The Agnes Irwin School · Classes of 2022-2026 1.0 · 5 over 5 class years
The Benjamin School · Five-Year Matriculation List, Classes of 2022-2026 1.0 · 5 over 5 class years
Kent Place School · 2022-2025 1.0 · 4 over 4 class years
University School of Nashville · 2022-2025 1.0 · 4 over 4 class years
Academy-Notre Dame De Namur · Class of 2026 1.0 · 1 over 1 class year
Berkshire School · Class of 2021 1.0 · 1 over 1 class year
Brooks School · Class of 2024 1.0 · 1 over 1 class year
Chadwick School · Class of 2025 As published 1.0 · 1 over 1 class year
Collegiate School · Class of 2026 College Enrollments / 2023-26 4-Year College Enrollments · counted column: Class of 2026 College Enrollments 1.0 · 1 over 1 class year
Community School Of Naples · class of 2026 1.0 · 1 over 1 class year
Falmouth Academy · Class of 2026 1.0 · 1 over 1 class year
Isidore Newman School · Class of 2026 1.0 · 1 over 1 class year
Nichols School · Class of 2026 1.0 · 1 over 1 class year
Notre Dame School of Manhattan · Class of 2025 1.0 · 1 over 1 class year
Pace Academy · Class of 2026 1.0 · 1 over 1 class year
Regis High School (NYC) · Class of 2022–2025 · counted column: Class of '25 1.0 · 1 over 1 class year
Rowland Hall · Class of 2026 1.0 · 1 over 1 class year
Rowland Hall-St. Mark's School · Class of 2026 1.0 · 1 over 1 class year
Saint Francis Catholic High School · Class of 2025 1.0 · 1 over 1 class year
St. Paul Academy and Summit School · Class of 2025 1.0 · 1 over 1 class year
The Bolles School · Class of 2026 1.0 · 1 over 1 class year
The Bryn Mawr School · Class of 2026 1.0 · 1 over 1 class year
The Galloway School · Class of 2025 1.0 · 1 over 1 class year
The Greenwich Country Day School · 2021-2025 · counted column: Class of 2025 Matriculation 1.0 · 1 over 1 class year
The Pembroke Hill School - Wornall Campus · Class of 2026 1.0 · 1 over 1 class year
Gilman School · classes of 2020-2024 0.8 · 4 over 5 class years
Maret School · classes of 2022–2026 As published 0.8 · 4 over 5 class years
The Browning School · Classes of 2022-26 0.8 · 4 over 5 class years
William Penn Charter School · 2022-2026 0.8 · 4 over 5 class years
Nightingale-Bamford School · 2022–2025 0.8 · 3 over 4 class years
The Putney School · (2023-2025) 0.7 · 2 over 3 class years
Archmere Academy · 2022-2026 0.6 · 3 over 5 class years
Northwood School · Classes of 2021-2025 0.6 · 3 over 5 class years
The Seven Hills School · 2021-2025 0.6 · 3 over 5 class years
Canterbury School · 2019-2024 0.5 · 3 over 6 class years
The Roxbury Latin School · 2021-2026 0.5 · 3 over 6 class years
Colorado Academy · Classes 2022-2025 0.5 · 2 over 4 class years
The Derryfield School · 2022-2025 0.5 · 2 over 4 class years
Berwick Academy · past five graduating classes (2021 – 2025) 0.4 · 2 over 5 class years
Linden Hall · 2022-2026 0.4 · 2 over 5 class years
Montgomery Bell Academy · 2022 – 2026 0.4 · 2 over 5 class years
Phoenix Country Day School · Classes of 2021-25 0.4 · 2 over 5 class years
Santa Fe Preparatory School · 2022-2026 0.4 · 2 over 5 class years
Severn School · Classes of 2022-2026 0.4 · 2 over 5 class years
Springside Chestnut Hill Academy · 2022-2026 0.4 · 2 over 5 class years
St. Christopher's School · 2022-2026 0.4 · 2 over 5 class years
The Barstow School · 2021-2025 0.4 · 2 over 5 class years
The Chapin School · 2022-2026 0.4 · 2 over 5 class years
University Prep · 2022–2026 0.4 · 2 over 5 class years
Keystone School (San Antonio) · 2020-2025 0.3 · 2 over 6 class years
Vermont Academy · Matriculation List (2021-2026) 0.3 · 2 over 6 class years
Belmont Hill School · 2022-2026 0.2 · 1 over 5 class years
Dublin School · 2023-2026 0.2 · 1 over 4 class years
Duchesne Academy of the Sacred Heart (Houston) · 2021 - 2024 0.2 · 1 over 4 class years
Ellis School · 2019–2023 0.2 · 1 over 5 class years
Fort Worth Country Day School · 2020-23 0.2 · 1 over 4 class years
Harrisburg Academy · 2021-2025 0.2 · 1 over 5 class years
The Rivers School · 2022-2026 0.2 · 1 over 5 class years

Published, but not ranked — these schools name New York University on a list of where their graduates enrolled whose class years we cannot read ("Since 2023", or no class year printed), so their totals are shown rather than divided: Pierrepont School (4, not stated); The Lovett School (3, List as of 5/1/2026 (no class year printed on the list itself; page 2 header reads "College Acceptance and Matriculation" and links this file as the "Class of 2026 matriculation list")).

Admitted — from the schools' acceptance lists

14 high schools publish a numbered list of college acceptances — where their graduates were admitted, not where they enrolled — and name New York University on it. Between them they printed 77 admissions. Ranked by admissions per class year to New York University, from each school's own published acceptances list: the number that school printed, divided by the class years its list covers. Admits are counted at each college a student was admitted to, the same way the UC Reach Score counts a student admitted to three UC campuses three times — so this is a count of admissions, not of students. The published total and the school's own years label are shown beside every school, and a list whose class years we cannot read is listed below with its total rather than divided by a guess.

High school · years its list covers Admitted per class year
Archbishop Mitty High School · Class of 2025 21.0 · 21 over 1 class year
Staten Island Academy · College Acceptances 2026 8.0 · 8 over 1 class year
Middlesex School · Class of 2026 · counted column: accepted 7.0 · 7 over 1 class year
Professional Childrens School · Class of 2026 3.0 · 3 over 1 class year
The TASIS School in Dorado · Class of 2026 3.0 · 3 over 1 class year
National Cathedral School · 2023-2025 2.3 · 7 over 3 class years
Lycée Français de San Francisco · Classes 2022, 2023, 2024 2.0 · 6 over 3 class years
Canterbury School-Fort Myers · Class of 2026 2.0 · 2 over 1 class year
The Altamont School · Classes of 2021-2025 1.8 · 9 over 5 class years
The Chapin School · 2022-2026 · counted column: Admitted 1.0 · 5 over 5 class years
and 4 more
Oratory Preparatory School · Class of 2025 1.0 · 1 over 1 class year
Wilmington Friends School · 2023 & 2024 0.5 · 1 over 2 class years
St Anselm'S Abbey School · 2022-2026 0.4 · 2 over 5 class years
Key School · 2021 - 2026 · counted column: Acceptances 2021–2026 0.3 · 2 over 6 class years

All 197 feeder schools, ranked →

Counted from each school's own published document, linked on that school's page. A high school that is not here does not publish a numbered list we could read — that is all absence means, and it says nothing about its graduates. Where a school publishes both, the two lists are shown separately: an acceptances list is not a list of enrollments, and the two are never added together.

Related reading
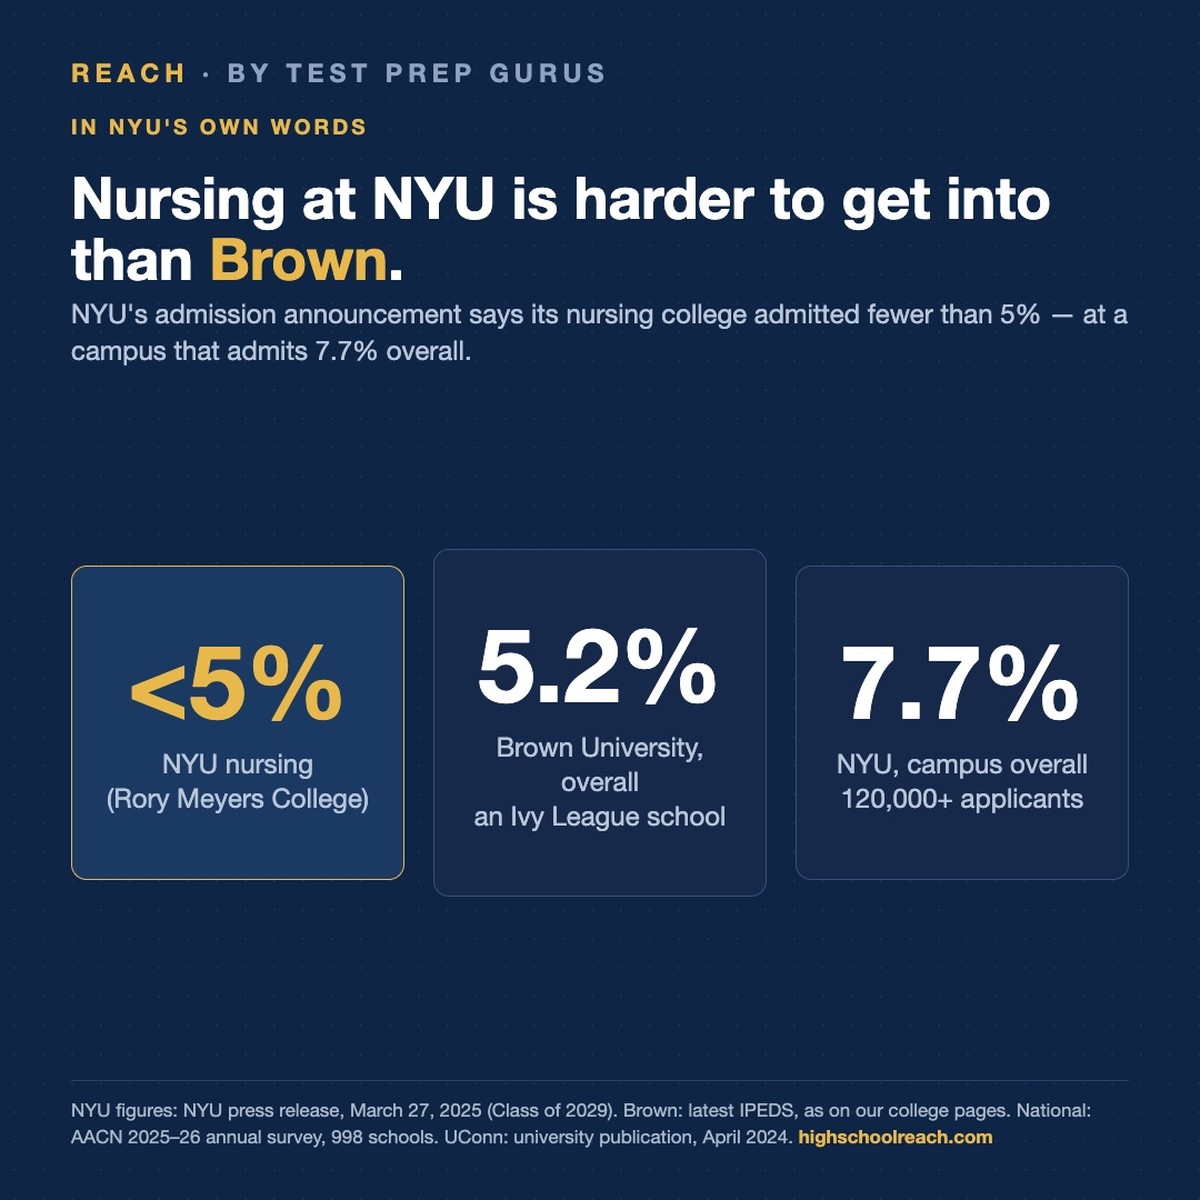
Nursing at NYU is harder to get into than Brown

College admissions · August 21, 2026

All stories from the data →

For Parents

Get alerts when New York University's numbers change

New admit rates, costs, and outcomes — a few alerts a year, no spam. Your email also saves your list across devices.

Objective, government-grade data — no school pays us for placement.

At a glance

JSON · Using this page with an AI assistant

New York University is a private nonprofit four-year college in NY. It admitted 9% of applicants (113,578 applied, 2023). Test policy: Test-optional.

Middle 50% of enrolled first-years who submitted that test: SAT 1480–1570, ACT 33–35. 27% of enrolled first-years submitted an SAT score, 12% an ACT — these ranges describe students who submitted, not the whole class. Average enrolled GPA 3.81 (unweighted, 2024-25, as published by the college).

Cost: about $37,050 a year on average with aid, $84,374 a year at full price.

Median earnings ten years after entry: $82,509 a year. Payoff, meaning ten years of that pay minus four years of cost: $676,890 ahead with aid, $487,594 ahead at full price.

Highest median earnings four years after the degree, by program: Management Sciences and Quantitative Methods ($158,559); Computer and Information Sciences, General ($142,495); Business/Commerce, General ($137,804).

Economic mobility (Opportunity Insights): 7% of students came from families in the bottom fifth of income, and 52% of those reached the top fifth as adults.

Aid pledge published by the college for 2024-25: families earning under $100,000 pay no tuition; aid packages carry no loans; the college meets full demonstrated need.

High schools that publish a numbered matriculation list and name New York University: 185, 1418 enrolled students between them — ranked by graduates per class year, most often Harvard-Westlake School (26.0 per class year, 26 over 1 class year, BY THE CLASSES OF 2021-2025, counted column "CLASS OF '25"); Choate Rosemary Hall (10.8 per class year, 54 over 5 class years, Class of 2021-2025); Crossroads School (9.7 per class year, 29 over 3 class years, classes of 2023-25). Each figure is the number that school printed divided by the class years its own list covers; the totals and years are shown. These are the schools that publish such a list, not every school that sends students; full list: https://highschoolreach.com/leaderboards/feeder-schools/new-york-university.

High schools that publish a numbered list of college acceptances naming New York University: 14, 77 admissions between them — ranked by admissions per class year, most often Archbishop Mitty High School (21.0 per class year, 21 over 1 class year, Class of 2025); Staten Island Academy (8.0 per class year, 8 over 1 class year, College Acceptances 2026); Middlesex School (7.0 per class year, 7 over 1 class year, Class of 2026, counted column "accepted"). Admits are counted at each college, so this counts admissions, not students. These are a different set of documents from the matriculation lists above and the two are never added together; full list: https://highschoolreach.com/leaderboards/feeder-schools/new-york-university.

Machine-readable version of this page: https://highschoolreach.com/colleges/new-york-university.json

By major: Art (Studio)BiochemistryBiologyBusiness AdministrationChemical EngineeringChemistryCivil EngineeringComputer EngineeringComputer ScienceEconomicsElectrical EngineeringEnglishFilm and TelevisionHistoryLiberal Studies (teacher preparation)MathematicsMechanical EngineeringMusicNeuroscienceNursing (BSN)Nutrition and DieteticsPhilosophyPhysicsPolitical SciencePsychologyPublic HealthSocial WorkSociologyTheatre
Get your child's odds →

What families ask next