The John Cooper School
The Woodlands · TX · Private independent · K-12 combined
Similar nearby schools
Most similar nearby schools
The Woodlands Preporatory School → Cunae International School → Paradigm Development Center → The Banff School → Rosehill Christian School → Woodlands Christian Academy → Frassati Catholic High School → Concordia Lutheran High School →At a glance
- 22 AP courses offered (school profile)
- SAT avg 1373 (25-75: 1295–1480)
- ACT avg 30 (25-75: 28–34)
Composed from the school's own published profile (2027), and other public data. Full breakdowns below.
How The John Cooper School compares for families
What families should know about The John Cooper School.
- ▸ LocallyTX students outperform the US average on NAEP 8th-grade math (+4 points).
- ▸ vs Similar SchoolsThe closest comparables nearby: The Woodlands Preporatory School, Cunae International School, Paradigm Development Center and 5 more. See the sidebar to compare side-by-side.
For Parents
Get alerts when The John Cooper School's numbers change
New admissions results, enrollment shifts, test scores — a few alerts a year, no spam. Your email also saves your list across devices.
Objective, government-grade data — no school pays us for placement.
Your state's public flagship
The University of Texas at Austin
The in-state tuition gap is the flagship's biggest draw — most in-state families pay far less than the out-of-state sticker. Average net price after aid runs about $19,857/yr. Admission odds depend on your student's GPA and test scores, not which high school they attend.
Source: IPEDS admissions, tuition & enrollment + College Scorecard net price. Flagship = the state's primary public research university.
Pay for college in Texas
Texas's public scholarships
Texas families have two big levers: a guaranteed-admission rule for the top of each graduating class, and the need-based TEXAS Grant that pairs with it. Class rank does more here than almost anywhere.
Graduate in the top 10% of your Texas public-HS class and finish the required curriculum for automatic admission to TX public universities (UT Austin caps at the top 5%). (Must finish the required college-prep curriculum (Distinguished plan).)
Official program details ↗Texas's flagship need-based grant — no GPA gate to qualify (a 3.0 or top-third rank just gives priority when funds run short). (Enroll within 16 months of HS, ≥¾ time, in a bachelor's program.)
Official program details ↗Graduate at least a semester early with the Distinguished plan plus a 3.0 GPA and an 80th-percentile test (or top-10% rank) for a TEXAS Grant-sized scholarship. (Graduate at least a semester early with the Distinguished plan.)
Official program details ↗Eligibility rules change yearly — confirm with the official program before relying on it. Amounts are recent published figures; awards cover tuition/fees, not housing or books unless noted. Verified 2026-06-14.
Their published matriculation list
Where the Class of 2022 - 2026 enrolled
The John Cooper School publishes where its graduates enrolled. What follows is copied from that document — 173 colleges, ordered by the number of students enrolled.
College · Students
and 143 more
These graduates went on to the colleges above.
Check your kid's odds at these colleges →We'll load the 10 colleges the class chose most often — add your name, email and your child's numbers and we'll see where your child lands at each.
Independently verified As published by The John Cooper School — The John Cooper School 2026-2027 Profile ↗. Found at: p.4, 'Matriculation - Class of 2022-2026' (Texas 36% / National 60% / International 4% tables, combined into one list).
Enrollment trend & projection
Private school enrollment comes from the NCES Private School Universe Survey (PSS), which is collected every other year — not annually like public-school data. The most recent published collection is 2021–22; NCES targeted spring 2026 for the 2023–24 release — we'll load it as soon as it's published.
For a more current snapshot, see The John Cooper School's own published school profile (as of 2027-28): johncooper.myschoolapp.com/ftpimages/798/download… ↗
If the recent trend holds…
At its recent rate of +1.5%/year, projecting from 2022's 1,257 students:
An extrapolation of the recent trajectory, not a forecast of the school's plans; ignores one-off shocks.
Revenue upside
At tuition per student, the 98 students projected to be gained by 2027 represent ≈ $1,568,000/year in tuition upside.
Tuition is an editable estimate (PSS doesn't publish tuition) — set it to your school's figure.
Most similar nearby high schools
The schools most like this one — same type, blended on distance and size — and where their enrollment is heading. These are the schools families here weigh against each other.
| School | Type | Miles | HS enrollment | Trend |
|---|---|---|---|---|
| The Woodlands Preporatory School Tomball |
Private | 1.7 | 27 | — |
| Cunae International School The Woodlands |
Private | 2.7 | 87 | +58.2% |
| Paradigm Development Center Houston |
Private | 13.6 | 11 | — |
| The Banff School Houston |
Private | 13.8 | 158 | +24.4% |
| Rosehill Christian School Tomball |
Private | 14.0 | 387 | -5.6% |
| Woodlands Christian Academy The Woodlands |
Private | 3.1 | 673 | +10.1% |
| Frassati Catholic High School Spring |
Private | 6.5 | 261 | +0.8% |
| Concordia Lutheran High School Tomball |
Private | 7.1 | 545 | -3.7% |
Related reading
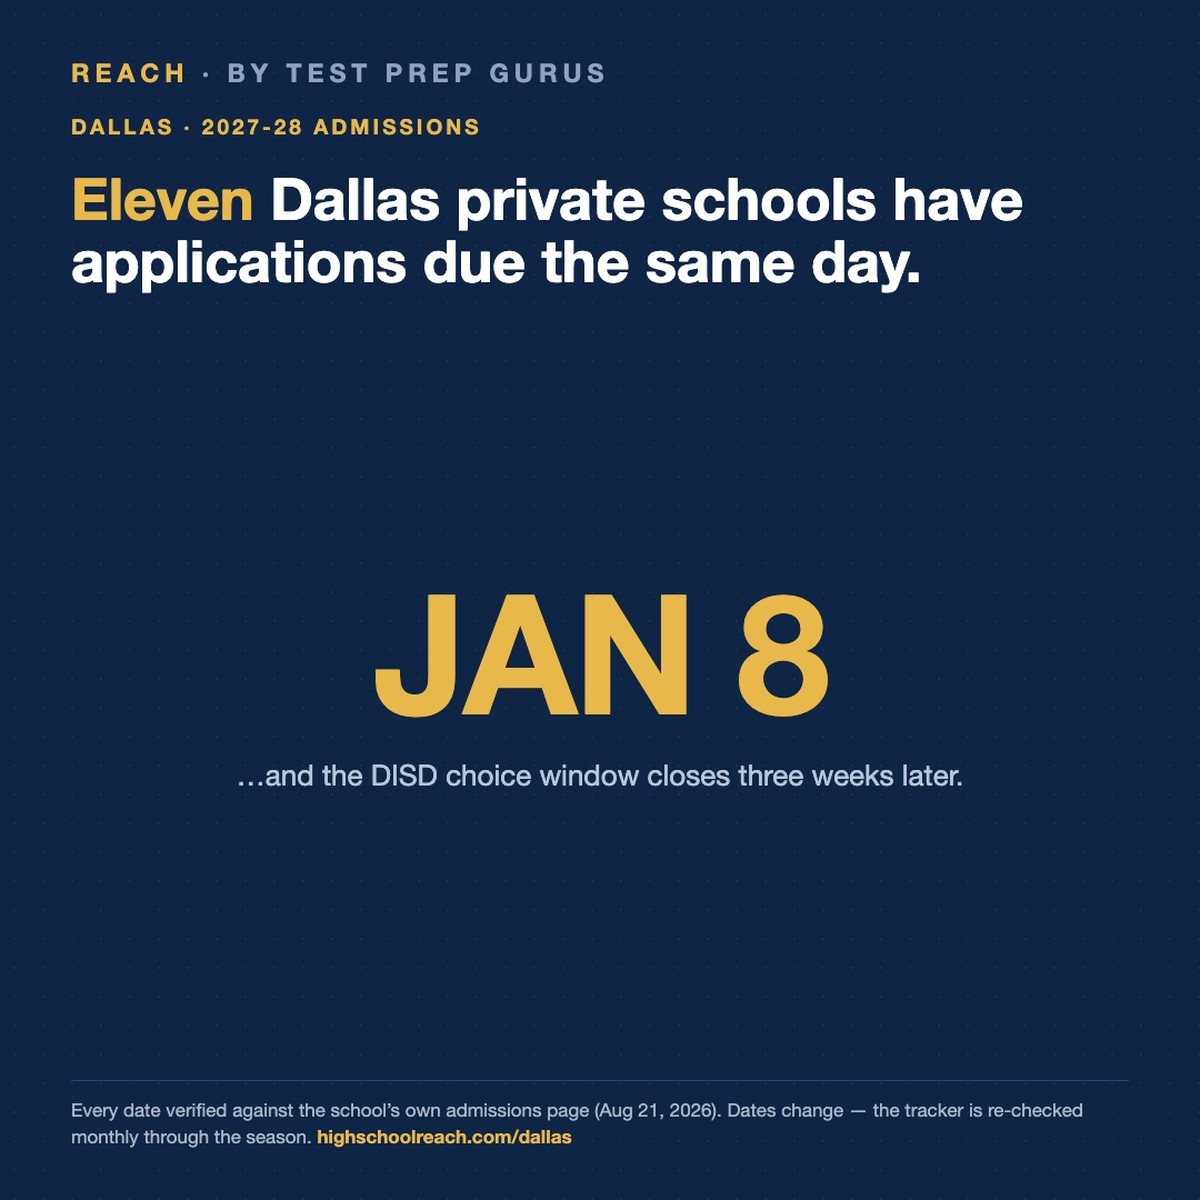
Dallas · August 26, 2026