Arrowhead Christian Academy

Redlands · San Bernardino County · Religious-affiliated

Private San Bernardino County ~106 seniors CDS 3667843…
Shareable scorecard →

Where grads go — and what it costs & pays

UC Reach Score
6
Below the CA median below the state median
Top-6 UC admits per 100 seniors in the Class of 2025 — counts each campus admit, so a student admitted to several UCs counts more than once (which is why a strong school can score over 100).

UC admits by campus · Class of 2025

UCSD
3 admitted
Net $12,470/yr avg
Grads earn $84,943 @10yr
UCSB
3 admitted
Net $16,109/yr avg
Grads earn $74,915 @10yr

Getting in is step one. The cost above is the average aid-receiving family's net price — yours depends on whether you qualify for aid — and your child's odds depend on their GPA + scores. See your family's real numbers at these campuses:

Get my child's odds + our real costs →

Sources: UC Office of the President (admits); IPEDS net price + College Scorecard 10-yr earnings (cost & payoff). Full campus-by-campus breakdown below.

You've seen Arrowhead Christian Academy. What are your child's real college odds? Check any college in 10 seconds — no email needed — then get the free Family Decision Report: Reach / Competitive / Match / Likely + the real cost range for every college on their list. Check odds →

How Arrowhead Christian Academy compares for families

Real college outcomes data available below.

  • StatewideUC Reach Score of 6 — 13 points below the California median of 19.
  • vs Similar SchoolsTrails the peer median (UC Reach Score 6 vs a 34 median) across the 5 most similar nearby schools.

For Parents

Get alerts when Arrowhead Christian Academy's numbers change

New admissions results, enrollment shifts, test scores — a few alerts a year, no spam. Your email also saves your list across devices.

Objective, government-grade data — no school pays us for placement.

No SBAC data for private schools — and that's not the metric you want anyway

California's Smarter Balanced (CAASPP) assessment is administered by the state, by statute, to public & charter schools only. Private schools don't sit for it. That's why the SBAC card is missing on this profile — not a data gap on our side, a deliberate scope of the state's testing program.

For private schools, UC Reach is the stronger academic signal anyway. SBAC measures grade-11 inputs (proficiency on a state standard); UC Reach measures outputs (who actually got into the most selective UCs). For private-school families weighing tuition against college outcomes, the outputs are the relevant signal.

Scroll up to the UC Reach card for Arrowhead Christian Academy's 2025 number, statewide percentile, and 5-year trend.

Enrollment trend & projection

Total enrollment (9–12)
343 (2020)1,232 (2025)
+259.2%
Grade 12 (graduating class)
77 (2020)106 (2025)
+37.7%

How does Arrowhead Christian Academy really compare on getting kids to college?

We've ranked it #8 of 9 most similar nearby schools on UC Reach. Unlock the full snapshot to see the head-to-head — who's ahead, by how much, and where it's heading.

The full head-to-head table — every peer school's UC Reach, side by side.
Enrollment trend + 3-year projection — is this school growing or quietly shrinking?
The plain-English read on what it all means for your family.

Your similar-school group includes

Loma Linda Academy · United Christian Academy · Aquinas High School · Redlands Adventist Academy · Linfield Christian School · St. Margaret's Episcopal School · +4 more

Objective, government-grade data — no school pays us for placement. We'll email you the snapshot and a few alerts a year. Unsubscribe anytime.

Key takeaway · Class of 2025

Arrowhead Christian Academy sent 64 applications to the six most selective University of California campuses and 9.4% were admitted, producing a UC Reach Score of 6 (top-6 UC admits per 100 seniors, counting a student at each campus that admitted them) — 13 points below the California median of 19, higher than 5% of California high schools..

UC Reach Score 6 6 admits (counted at each UC) / 106 seniors -28 pts vs. peer median (34) · #8 of 9 similar schools methodology
Where this sits on the California curve
CA median
19
Peer median
34
Top 10%
53
This school
6
050100
CA median 19 Top 10% ≥ 53 This school 6

Higher than 5% of California high schools (1107 ranked, ≥50 seniors)

What this number means

Arrowhead Christian Academy's UC Reach Score of 6 is below the California median (19). The top 10% of CA schools achieve 53 or higher.

Against similar schools, Arrowhead Christian Academy trails the peer-group median (34) — even though it looks strong vs. the state average.

Overall, Arrowhead Christian Academy's UC Reach is higher than 5% of California high schools (1107 ranked).

UC Application Reach Score
60
64 applications
In context: CA median 81 · Top 10% statewide ≥ 240 · San Bernardino Co. Top 10% ≥ 129 · higher than 36% of CA HS.
UC Admit Rate
9.4%
6 / 64 applications
In context: CA median 26.0% · Top 10% statewide ≥ 40.4% · higher than 0% of CA HS.
UC Yield Rate
N/A
— enrolled of 6 admitted
Yield vs. Enrollment Reach: Yield answers "of UC admits, what % chose UC?" — denominator is just the admits. A small admitted cohort can post a low yield even when the school sends a healthy share of its class to UC.
UC Enrollment Reach Score
N/A
— enrollees / 106 seniors
Enrollment Reach vs. Yield: Reach answers "of the whole senior class, what share ended up at UC?" — denominator is everyone. High Yield with low Enrollment Reach is common at elite privates: most admits matriculate, but the school sends most of its class to non-UC selective colleges.
Selective UC Reach (UCB, UCLA, UCSD, UCSB, UCI — incl. the Elite two)
5.7
per 100 seniors · campus-level total
In context: CA median 15.9 · Top 10% statewide ≥ 42.2 · higher than 5% of CA HS.
Elite UC Reach (UCB + UCLA)
N/A
Senior Class Size
106
Private School Affidavit
Total School Enrollment
1,232
All grades · Private School Affidavit

Private-school figures come from the California Private School Affidavit. Per CDE, inclusion in private-school data is not an evaluation, approval, or endorsement of a school.

Campus Breakdown — 2025

Campus Applicants Admits Enrollees Admit Rate UC Reach Score Yield Avg GPA (App) Avg GPA (Adm)
UC Berkeley → Elite 7
UCLA → Elite 14
UC San Diego → Selective 16 3 18.8% 3
UC Santa Barbara → Selective 6 3 50.0% 3
UC Irvine → Selective 12
UC Davis → 9
= UCOP-suppressed (count below 3 students, hidden for privacy — actual value is 0, 1, or 2, not necessarily zero). Campus-level totals may count one student admitted to multiple UC campuses more than once; Admit Volume metrics are not the same as UC Reach, which is measured against the whole senior class. See methodology →

What This Means

A large share of the senior class applies to UC, indicating strong college-going culture and UC pipeline development.
A large share of the class applies to UC, so the admit rate runs lower than the application volume alone might suggest — expected when many students apply broadly, including to reach campuses. UC Reach (which credits every admit relative to the class) is the truer read of how the class fares: a strong Reach alongside a moderate admit rate is healthy, not a contradiction.
Fewer than 15% of seniors are earning UC admission. This may reflect a high non-UC college-going rate, significant A-G completion gaps, or an early-stage UC pipeline. A deeper review of A-G readiness and counseling capacity is warranted.
Note: the UC Reach Score sums campus-level admits across the top-six UC campuses, so a student admitted to both UCLA and UCSD is counted at each. It reflects competitive admit volume relative to class size — admit-events, not distinct students — which is why a Score can exceed 100.
Compare with other schools → See San Bernardino County rankings →

Related reading

The data Newsom asked for already exists — school by school

UC testing review · August 25, 2026

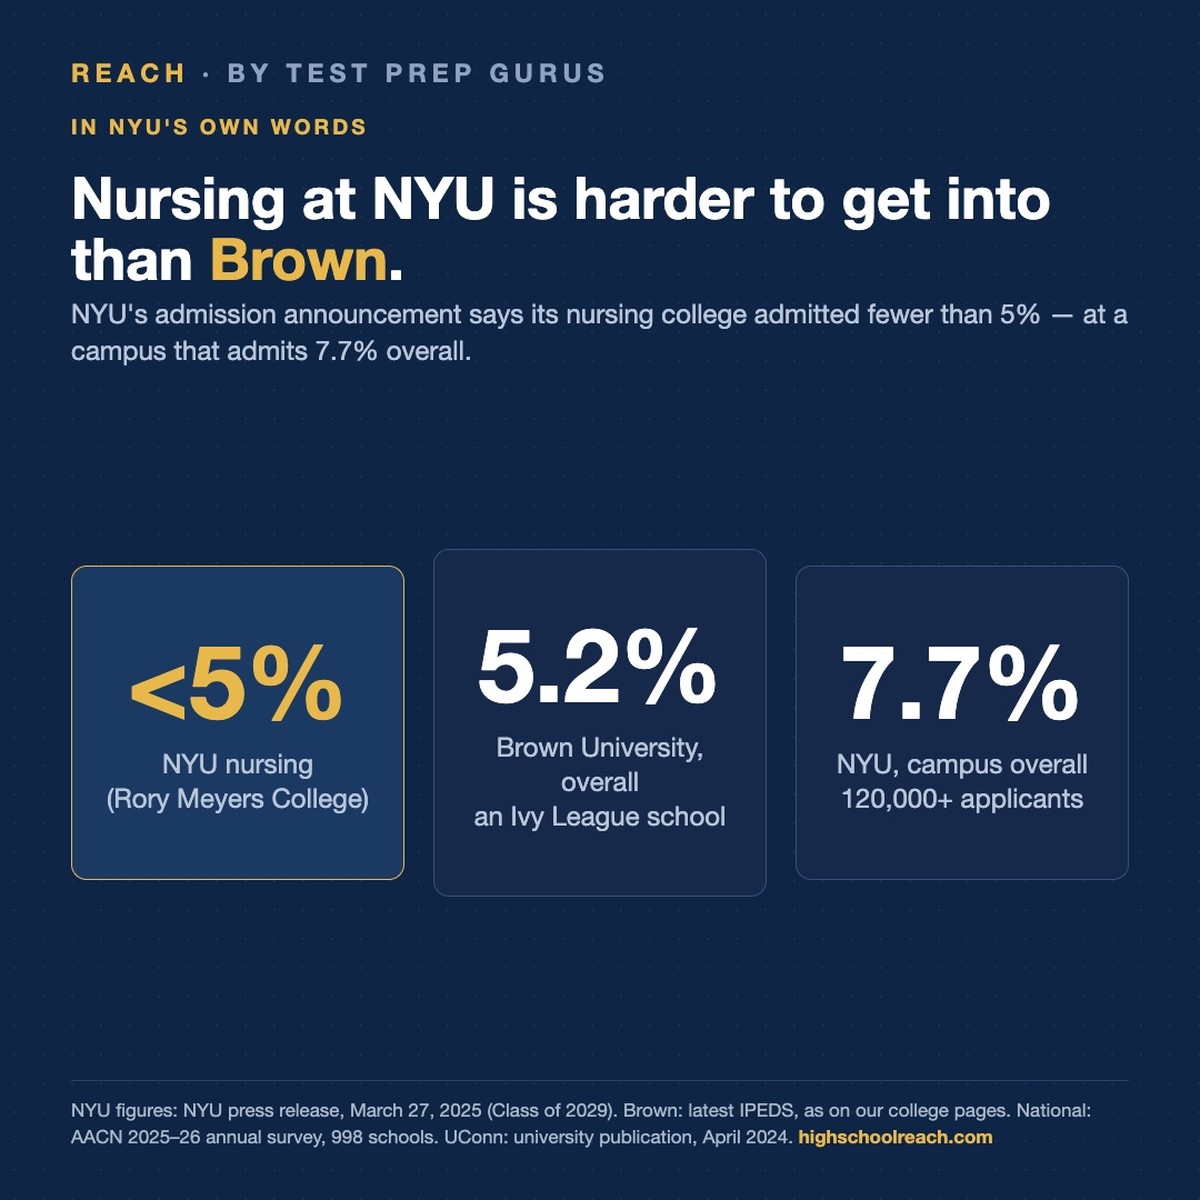
Nursing at NYU is harder to get into than Brown

College admissions · August 21, 2026

All stories from the data →

For Parents

Researching colleges for your kid at Arrowhead Christian Academy?

Check any college's odds in 10 seconds — no email needed — then get the free Family Decision Report: Reach / Competitive / Match / Likely with real admit odds and your real net price, for every college on their list.

Check your child's odds →

For School Admins looking at enrollment trends: request a Reach Report →

What are your child's odds? →

What families ask next