County Sort table by Diagnosis Type Year Reset filters

🏆 Top 10 in Orange County — UC Reach Score

Orange County · 2025 · ≥50 seniors
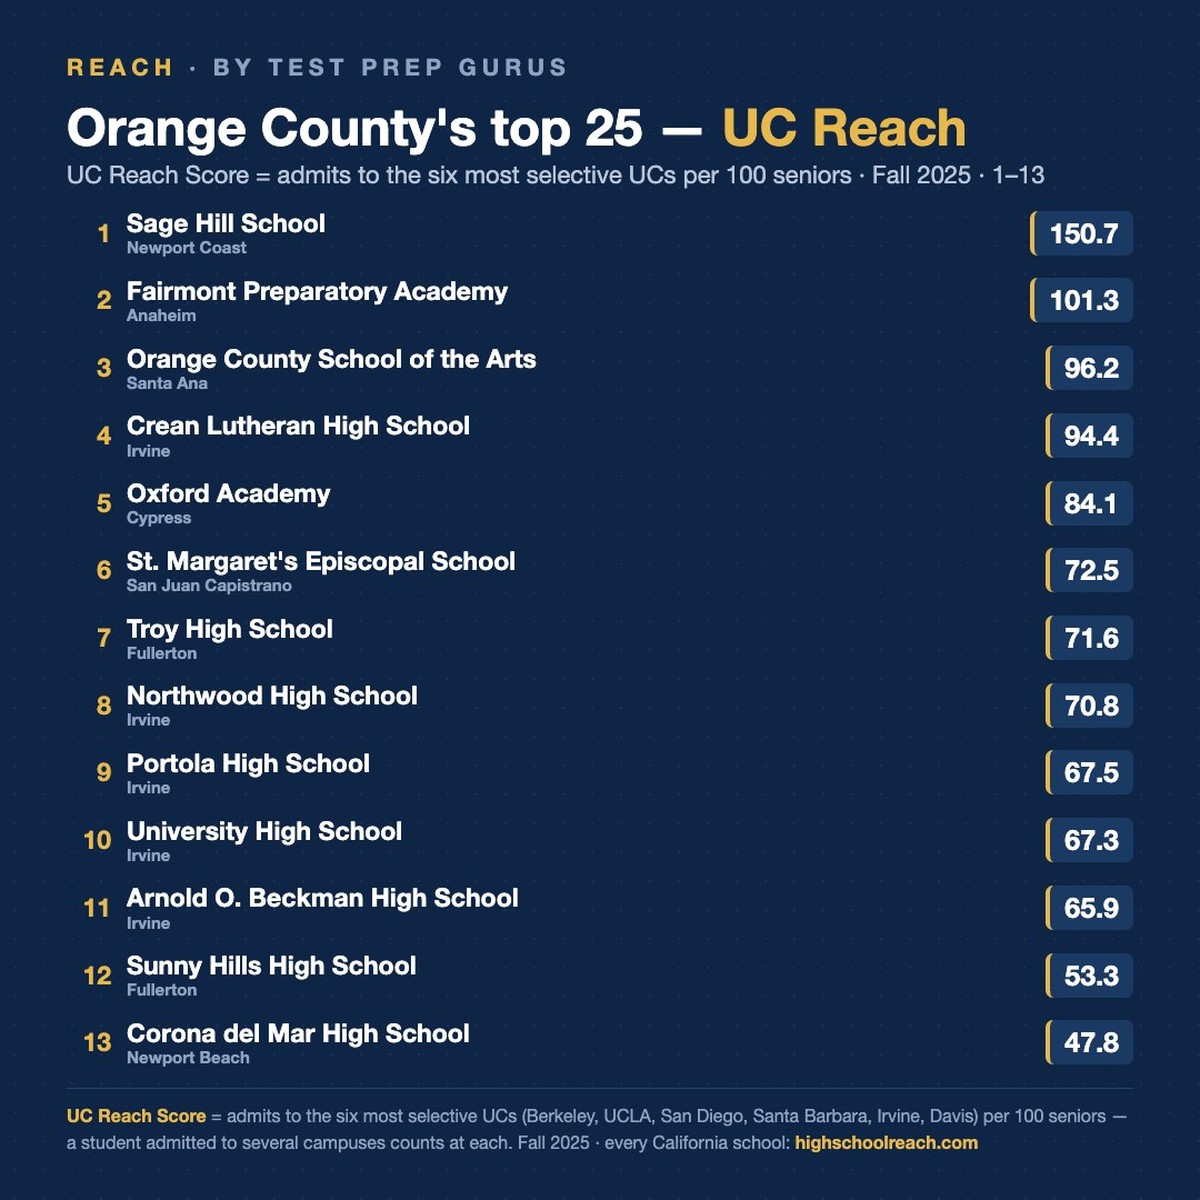
What is UC Reach? UC Reach = unique top-6 UC admits ÷ senior class size — the share of a school's entire graduating class that reaches the six most selective UCs (Berkeley, UCLA, San Diego, Santa Barbara, Irvine, Davis). It's a better gauge of school-wide success than admit rate, which only reflects the handful of students who applied.
Why it beats admit rate: if 6 students apply to the top UCs and all get in, that's a 100% admit rate — but at a 1,000-senior school it's a UC Reach Score of just 0.6 (6 ÷ 1,000). By contrast, a school where 250 of 1,000 seniors land a top-UC admit has a UC Reach Score of 25 — far stronger, even though its admit rate is lower.
Why some schools are over 100? Out of every 100 seniors at these schools, the class is generating more than 100 admissions to the six most selective UCs — meaning the typical strong student is getting in at multiple top campuses (UCLA + UCSD, or Berkeley + UCSB + Irvine, for example). It's a rare achievement: fewer than 1% of California high schools clear a UC Reach Score of 100.

Leaderboards by type — Orange County (2025)

Top and bottom schools by UC Reach, split public/charter vs private (≥50 seniors). Scoped to Orange County — change the County filter above to rescope.

▲ Top 10 Public + Charter

Orange County

1
Santa Ana · Charter
96
2
Cypress · Public
84
3
Fullerton · Public
72
4
Irvine · Public
71
5
Irvine · Public
67
6
· Public
67
7
Irvine · Public
66
8
Fullerton · Public
53
9
Newport Beach · Public
48
10
Laguna Beach · Public
47

▲ Top 10 Private

Orange County

1
Newport Coast · Private
151
2
Anaheim · Private
101
3
Irvine · Private
94
4
San Juan Capistrano · Private
73
5
Rancho San Margarit · Private
37
6
Orange · Private
37
7
Santa Ana · Private
36
8
San Juan Capistrano · Private
33
9
Fullerton · Private
28
10
Anaheim · Private
25

▼ Bottom 10 Public + Charter

Orange County

1
Orange · Public
7
2
Santa Ana · Public
8
3
Anaheim · Public
9
4
La Habra · Public
10
5
Lake Forest · Public
10
6
Anaheim · Public
11
7
Anaheim · Public
11
8
Orange · Public
12
9
Huntington Beach · Public
12
10
Anaheim · Public
13

▼ Bottom 10 Private

Orange County

1
Anaheim · Private
25
2
Fullerton · Private
28
3
San Juan Capistrano · Private
33
4
Santa Ana · Private
36
5
Orange · Private
37
6
Rancho San Margarit · Private
37
7
San Juan Capistrano · Private
73
8
Irvine · Private
94
9
Anaheim · Private
101
10
Newport Coast · Private
151

🎯 Specialized high schools — Orange County · 2025

Top UC Reach for schools with senior classes of 25–99. These are typically magnet programs, specialized charters, and small Catholic preps — too small to compare cleanly against comprehensive public high schools, but the most UC-effective small schools in California are here.

▲ Top 10 Small Public + Charter

Orange County

1
· Public
100
2
Tustin · Public
87
3
· Public
80
4
Costa Mesa · Public
37
5
· Public
18
6
Santa Ana · Public
11

▲ Top 10 Small Private

Orange County

1
Irvine · Private
65
2
Santa Ana · Private
28
3
San Juan Capistrano · Private
19
4
Newport Beach · Private
14
5
La Habra · Private
6

Top 10 by individual UC campus — Orange County · 2025

Where each UC campus lands its admits, as a share of each high school's senior class. Same 50-senior floor.

Top 10 — UCB Reach

UC Berkeley

1
Newport Coast · Private
14
2
Anaheim · Private
12
3
Santa Ana · Charter
11
4
San Juan Capistrano · Private
9
5
Cypress · Public
8
6
Fullerton · Public
8
7
Laguna Beach · Public
7
8
Irvine · Private
6
9
· Public
6
10
Irvine · Public
6

Top 10 — UCLA Reach

UCLA

1
Newport Coast · Private
12
2
Santa Ana · Charter
10
3
Anaheim · Private
7
4
Cypress · Public
6
5
Fullerton · Public
5
6
Laguna Beach · Public
5
7
Irvine · Public
4
8
· Public
4
9
San Juan Capistrano · Private
4
10
Irvine · Public
4

Top 10 — UCSD Reach

UC San Diego

1
Newport Coast · Private
18
2
Anaheim · Private
17
3
Santa Ana · Charter
16
4
Irvine · Private
16
5
· Public
16
6
Cypress · Public
14
7
Garden Grove · Public
13
8
Santa Ana · Public
12
9
Irvine · Public
11
10
Fullerton · Public
11

Top 10 — UCSB Reach

UC Santa Barbara

1
Newport Coast · Private
43
2
Anaheim · Private
21
3
Santa Ana · Charter
20
4
Irvine · Private
20
5
San Juan Capistrano · Private
20
6
Fullerton · Public
16
7
· Public
15
8
Irvine · Public
14
9
Irvine · Public
14
10
Irvine · Public
13

Top 10 — UCI Reach

UC Irvine

1
Newport Coast · Private
39
2
Cypress · Public
26
3
Irvine · Private
26
4
Santa Ana · Charter
23
5
Anaheim · Private
22
6
Irvine · Public
19
7
Irvine · Public
19
8
San Juan Capistrano · Private
19
9
Irvine · Public
18
10
· Public
17

Top 10 — UCD Reach

UC Davis

1
Newport Coast · Private
25
2
Irvine · Private
22
3
Anaheim · Private
22
4
Irvine · Public
19
5
Irvine · Public
18
6
Cypress · Public
17
7
San Juan Capistrano · Private
17
8
· Public
16
9
Santa Ana · Charter
16
10
Fullerton · Public
15

Beyond UC Reach — more lenses on Orange County

UC Reach measures who gets in. These lenses measure the upstream pipeline (A-G), the downstream outcome (UC graduation), the capacity that drives the pipeline (counselors), reliability over time (consistency), grade-11 academic preparation (CAASPP SBAC ELA & Math), and private-school financial strength. Click any school for its full profile.

Top 10 — A-G Completion

% of graduates meeting UC/CSU course requirements · 2024-25 cohort

1
Cypress · Public
99.5%
2
· Public
99.1%
3
· Public
97.9%
4
Tustin · Public
94.5%
5
Santa Ana · Charter
88.1%
6
Santa Ana · Public
86.8%
7
Laguna Beach · Public
86.6%
8
Costa Mesa · Public
82.4%
9
Los Alamitos · Public
82.0%
10
· Public
79.1%

Top 10 — UC 6-Yr Grad Rate

% of UC entrants who finished in 6 years · cohort N ≥ 20

1
Garden Grove · Public
98.5%
2
Lake Forest · Public
96.7%
3
Irvine · Public
96.5%
4
La Palma · Public
96.4%
5
Mission Viejo · Public
95.9%
6
Newport Coast · Private
95.8%
7
Orange · Private
95.7%
8
Anaheim · Public
95.7%
9
Irvine · Public
95.4%
10
Placentia · Public
95.1%

Top 10 — Best Counselor Capacity

Lowest students-per-counselor (ASCA target 250:1) · public/charter, ≥500 students

1
· Public
146:1
2
· Public
206:1
3
· Public
230:1
4
Costa Mesa · Public
239:1
5
· Public
247:1
6
Anaheim · Public
252:1
7
Tustin · Public
253:1
8
· Public
261:1
9
Fountain Valley · Public
265:1
10
Laguna Beach · Public
273:1

Top 10 — Most Consistent

Lowest UC Reach std-dev across 5 years (above-CA-median mean)

1
avg 28.8 · σ 2.31
σ 2.31
2
avg 23.8 · σ 2.31
σ 2.31
3
avg 29.3 · σ 3.24
σ 3.24
4
avg 26.1 · σ 3.53
σ 3.53
5
avg 29.1 · σ 3.63
σ 3.63
6
avg 33.5 · σ 3.65
σ 3.65
7
avg 35.0 · σ 4.64
σ 4.64
8
avg 22.7 · σ 4.67
σ 4.67
9
avg 30.4 · σ 4.9
σ 4.9
10
avg 41.5 · σ 5.21
σ 5.21

Top 10 — SBAC ELA met/exceeded

% Met or Exceeded Standard · Grade 11 CAASPP · public/charter · tested ≥30

1
Cypress · n=185 · 2025
98%
2
· n=99 · 2025
97%
3
Costa Mesa · n=40 · 2025
95%
4
Rancho San Margarit · n=465 · 2025
90%
5
Tustin · n=97 · 2025
90%
6
Fullerton · n=559 · 2025
87%
7
Santa Ana · n=424 · 2025
85%
8
Irvine · n=679 · 2025
83%
9
Fountain Valley · n=758 · 2025
81%
10
Fullerton · n=581 · 2025
81%

Top 10 — SBAC Math met/exceeded

% Met or Exceeded Standard · Grade 11 CAASPP · public/charter · tested ≥30

1
Cypress · n=185 · 2025
95%
2
Fullerton · n=560 · 2025
78%
3
Costa Mesa · n=40 · 2025
75%
4
· n=486 · 2025
72%
5
Irvine · n=543 · 2025
72%
6
Santa Ana · n=423 · 2025
65%
7
Rancho San Margarit · n=465 · 2025
65%
8
Fullerton · n=592 · 2025
63%
9
Irvine · n=639 · 2025
63%
10
· n=555 · 2025
63%

Top 10 — Private Net Assets

Wealthiest CA private high schools · IRS Form 990 · latest fiscal year

1
Newport Coast · Nonsectarian · FY 2023
$92.5M
2
San Juan Capistrano · Catholic · FY 2023
$87.4M
3
Irvine · Other religious · FY 2016
$17.6M
4
Newport Beach · Other religious · FY 2023
$16.7M
5
La Habra · Other religious · FY 2023
$10.2M
6
Fullerton · Other religious · FY 2023
$890,043
7
Anaheim · Nonsectarian · FY 2024
$677,096
8
Fullerton · Other religious · FY 2023
$-618,784

Reach momentum — biggest gains & declines over time

≥50 seniors · earliest→latest year

Which schools are moving a growing — or shrinking — share of their graduating class into the six most selective UCs. Reflects the current county/type filter.

▲ Biggest gains

SchoolThen → NowΔ
Newport Coast · Private
121 '20 → 151 '25 +29.8pp
Santa Ana · Public
15 '18 → 40 '25 +25.2pp
Laguna Beach · Public
31 '18 → 47 '25 +16.3pp
Fullerton · Public
38 '18 → 53 '25 +15.7pp
Yorba Linda · Public
25 '18 → 39 '25 +13.4pp
Santa Ana · Charter
83 '20 → 96 '25 +12.8pp
Garden Grove · Public
22 '18 → 34 '25 +12.2pp
· Public
28 '18 → 40 '25 +12.2pp
Brea · Public
21 '18 → 33 '25 +11.9pp
Irvine · Public
55 '18 → 66 '25 +11.0pp

▼ Biggest declines

SchoolThen → NowΔ
Cypress · Public
110 '18 → 84 '25 -26.3pp
Irvine · Public
90 '20 → 68 '25 -22.4pp
Orange · Private
52 '20 → 37 '25 -15.2pp
San Juan Capistrano · Private
87 '20 → 72 '25 -14.2pp
San Juan Capistrano · Private
46 '20 → 33 '25 -13.0pp
Anaheim · Private
36 '20 → 25 '25 -11.5pp
Dana Point · Public
29 '18 → 19 '25 -10.3pp
· Public
34 '18 → 25 '25 -9.2pp
Anaheim · Public
37 '18 → 29 '25 -8.2pp
Rancho San Margarit · Private
44 '20 → 37 '25 -7.0pp

Demand momentum — biggest gaps vs the county baseline

grade-12 enrollment Δ vs. county · ≥80 students

The demographic tide is shrinking CA enrollment ~10% over 7 years statewide, so absolute decline alone is noise. The gap vs the county baseline is the actionable signal — schools losing share faster than their demographic floor are the ones to watch. Reflects the current county/type filter.

▲ Outperforming the county the most

SchoolSchool · CountyGap
Irvine · Orange · Public  Best in class
+55.8% vs -10.2% +66.0pp
Santa Ana · Orange · Charter  Best in class
+46.1% vs -10.2% +56.3pp
Tustin · Orange · Public  Best in class
+34.7% vs -11.4% +46.1pp
· Orange · Public  Best in class
+20.5% vs -7.1% +27.5pp
Santa Ana · Orange · Public  Demand hides churn
+18.1% vs -7.1% +25.2pp
San Juan Capistrano · Orange · Public  Best in class
+15.4% vs -7.1% +22.4pp
Placentia · Orange · Public  Strong demand
+11.6% vs -7.1% +18.7pp
Santa Ana · Orange · Public  Demand hides churn
+10.0% vs -7.1% +17.1pp
Santa Ana · Orange · Public  Best in class
+8.0% vs -7.1% +15.1pp
Orange · Orange · Public  Demand hides churn
+7.8% vs -7.1% +14.9pp

▼ Underperforming the county the most

SchoolSchool · CountyGap
Mission Viejo · Orange · Public  Material decline
-40.1% vs -7.1% -33.0pp
Dana Point · Orange · Public  Material decline
-30.7% vs -7.1% -23.7pp
Tustin · Orange · Public  Compounding decline
-29.2% vs -7.1% -22.2pp
Huntington Beach · Orange · Public  Material decline
-25.7% vs -7.1% -18.6pp
Lake Forest · Orange · Public  Material decline
-25.2% vs -7.1% -18.1pp
Anaheim · Orange · Public  Compounding decline
-24.4% vs -7.1% -17.3pp
Rancho San Margarit · Orange · Public  Sharp downturn
-23.6% vs -7.1% -16.6pp
Anaheim · Orange · Public  Compounding decline
-22.8% vs -7.1% -15.8pp
Anaheim · Orange · Public  Compounding decline
-21.0% vs -7.1% -14.0pp
Laguna Beach · Orange · Public  Sharp downturn
-20.9% vs -7.1% -13.8pp

GPA Performance — over/under their predicted UC admit rate

67 schools eligible · 2025

Each dot is one school. The diagonal is the per-campus GPA expectation — points above it admit students at higher rates than their GPA mix predicts; points below admit at lower rates. Schools need ≥30 top-6 UC applications and data across ≥3 campuses to appear.

▲ Top 10 outperformers

School GPA Actual Δ vs exp.
Fullerton · Public
4.01 35.1% +14.8pp
Santa Ana · Public
3.94 34.0% +13.6pp
Costa Mesa · Public
3.85 35.4% +11.0pp
Garden Grove · Public
3.91 29.6% +10.0pp
· Public
3.75 27.9% +8.4pp
Laguna Hills · Public
3.99 28.7% +7.9pp
Anaheim · Public
3.78 26.9% +7.5pp
Santa Ana · Public
3.81 26.7% +7.3pp
Anaheim · Public
3.83 24.8% +6.9pp
· Public
3.87 26.8% +6.9pp

▼ Top 10 underperformers

School GPA Actual Δ vs exp.
Lake Forest · Public
3.85 13.5% -7.9pp
Anaheim · Public
3.99 16.1% -5.1pp
La Palma · Public
3.82 15.0% -4.6pp
Mission Viejo · Public
3.87 17.3% -3.1pp
Rancho San Margarit · Public
4.06 20.0% -2.9pp
La Habra · Public
3.91 17.4% -2.4pp
Irvine · Public
3.87 18.2% -2.0pp
La Habra · Public
3.91 18.6% -1.7pp
Santa Ana · Public
3.54 20.9% -1.0pp
Yorba Linda · Public
3.91 20.1% -0.8pp

Full rankings — every Orange County high school by UC Reach Score

Sortable by any column. Click a column header to sort. Click any school row to open its profile.

78 schools · 2025 data · 20 hidden (under 100 seniors)
Show all schools (no floor) Compare selected schools →
# School County Seniors Total Enroll UC Reach Score App Reach Score Admit Rate Yield Selective Reach Elite Reach Raw Apps Raw Admits
1
Newport Coast · Private
Orange 148 590 151 447 33.7% 6.3% 125.7 25.7 661 223
2
Anaheim · Private
Orange 156 619 101 371 27.3% 22.1% 78.8 19.2 578 158
3
Santa Ana · Charter  Best in class
Orange 393 1,806 96 288 33.4% 20.1% 80.2 20.9 1,133 378
4
Irvine · Private
Orange 285 1,126 94 258 36.5% 15.6% 71.9 10.2 736 269
5
Cypress · Public  Best in class
Orange 201 1,315 84 363 23.2% 26.6% 67.2 14.4 729 169
6
San Juan Capistrano · Private
Orange 102 1,159 73 295 24.6% 55.9 11.8 301 74
7
Fullerton · Public  Weak at the gate
Orange 648 2,504 72 295 24.3% 20.0% 56.5 13.3 1,912 464
8
Irvine · Public  Weak at the gate
Orange 603 2,244 71 298 23.7% 25.3% 51.7 10.1 1,799 427
9
Irvine · Public  Best in class
Orange 624 2,693 67 299 22.6% 26.4% 49.0 9.1 1,865 421
10
· Public  Demand problem
Orange 572 2,307 67 308 21.9% 23.4% 51.0 10.3 1,760 385
11
Irvine · Public  Best in class
Orange 672 2,776 66 244 27.0% 25.5% 53.1 9.2 1,641 443
12
Fullerton · Public  Best in class
Orange 614 2,337 53 213 25.0% 26.3% 40.2 8.5 1,306 327
13
Newport Beach · Public  Weak at the gate
Orange 370 2,106 48 200 23.9% 23.7% 36.8 8.7 741 177
14
Laguna Beach · Public  Sharp downturn
Orange 196 815 47 180 26.1% 30.4% 39.3 11.2 352 92
15
Irvine · Public  Holding share
Orange 540 2,232 46 212 21.7% 25.0% 38.0 8.5 1,145 248
16
Irvine · Public  Demand problem
Orange 502 1,964 43 236 18.2% 27.3% 31.3 6.4 1,185 216
17
Santa Ana · Public  Best in class
Orange 136 842 40 119 34.0% 14.6% 32.4 5.2 162 55
18
· Public  Holding share
Orange 542 2,041 40 161 25.0% 31.6% 35.8 5.0 873 218
19
Yorba Linda · Public  Holding share
Orange 332 1,631 39 192 20.1% 23.4% 28.6 5.1 638 128
20
Rancho San Margarit · Private
Orange 421 1,823 37 172 21.6% 23.1% 29.9 8.6 723 156
21
Orange · Private
Orange 210 1,141 37 190 19.2% 16.9% 28.1 5.7 400 77
22
Santa Ana · Private
Orange 514 1,849 36 176 20.6% 28.9% 30.7 7.0 906 187
23
Mission Viejo · Public  Tracking
Orange 496 1,991 35 141 25.2% 29.6% 29.8 5.2 699 176
24
Aliso Viejo · Public  Tracking
Orange 683 2,563 34 134 25.6% 23.4% 26.8 4.4 917 235
25
Garden Grove · Public  Material decline
Orange 529 2,148 34 114 29.6% 32.0% 30.8 4.7 602 178
26
San Juan Capistrano · Private
Orange 320 1,282 33 142 23.1% 20.0% 26.9 7.5 455 105
27
Los Alamitos · Public  Weak at the gate
Orange 756 2,915 33 132 24.8% 25.4% 27.1 5.6 1,001 248
28
Brea · Public  Holding share
Orange 444 1,676 33 139 23.6% 18.6% 26.1 5.2 615 145
29
Rancho San Margarit · Public  Sharp downturn
Orange 552 2,030 32 158 20.0% 32.2% 24.5 3.8 870 174
30
Cypress · Public  Best in class
Orange 682 2,685 30 145 21.0% 33.6% 25.2 4.2 991 208
31
Anaheim · Public  Best in class
Orange 520 2,183 29 179 16.1% 34.0% 25.0 4.8 931 150
32
Laguna Hills · Public  Demand problem
Orange 330 1,317 28 99 28.8% 18.1% 24.2 4.5 327 94
33
Fountain Valley · Public  Weak at the gate
Orange 803 3,171 28 143 19.8% 36.1% 23.4 4.2 1,145 227
34
Fullerton · Private
Orange 107 462 28 124 22.6% 10.0% 20.6 133 30
35
Placentia · Public  Tracking
Orange 618 2,411 28 132 21.0% 27.3% 20.7 4.0 818 172
36
Garden Grove · Public  Demand problem
Orange 425 1,701 27 117 23.1% 34.8% 24.2 4.5 497 115
37
Huntington Beach · Public  Tracking
Orange 698 2,645 27 119 22.4% 34.2% 22.4 5.3 834 187
38
Newport Beach · Public  Strong demand
Orange 526 2,084 25 94 27.2% 29.9% 21.9 3.8 493 134
39
San Juan Capistrano · Public  Best in class
Orange 703 2,641 25 111 22.9% 25.3% 19.4 2.6 777 178
40
· Public  Best in class
Orange 536 2,126 25 108 22.8% 26.5% 18.3 4.5 580 132
41
Anaheim · Private
Orange 187 767 25 157 15.7% 6.5% 18.2 2.1 294 46
42
Huntington Beach · Public  Material decline
Orange 507 1,997 24 94 25.3% 25.0% 19.3 4.3 475 120
43
Mission Viejo · Public  Demand problem
Orange 597 2,475 23 101 23.1% 29.5% 18.4 3.5 601 139
44
Placentia · Public  Strong demand
Orange 433 1,998 22 103 21.8% 25.8% 18.7 3.7 446 97
45
· Public  Best in class
Orange 550 2,049 21 83 25.6% 25.6% 17.4 3.3 457 117
46
Westminster · Public  Demand problem
Orange 644 2,529 21 95 22.2% 28.7% 19.1 3.7 613 136
47
Fullerton · Public  Both ends slipping
Orange 441 1,880 21 59 35.1% 20.6% 16.6 3.2 262 92
48
· Public  Both ends slipping
Orange 457 1,664 21 77 26.8% 30.9% 18.6 3.9 351 94
49
Villa Park · Public  Demand problem
Orange 467 2,023 21 92 22.4% 29.2% 15.8 3.0 428 96
50
Garden Grove · Public  Both ends slipping
Orange 373 1,439 20 81 25.2% 26.3% 17.4 2.7 301 76
51
Santa Ana · Public  Best in class
Orange 595 2,376 20 75 26.7% 27.7% 16.6 3.2 445 119
52
San Clemente · Public  Demand problem
Orange 745 2,740 20 83 23.8% 26.5% 15.3 2.7 618 147
53
Dana Point · Public  Material decline
Orange 473 1,725 19 92 20.6% 32.2% 16.1 3.4 437 90
54
Garden Grove · Public  Holding share
Orange 405 1,634 18 95 19.3% 39.2% 15.1 1.5 384 74
55
Anaheim · Public  Compounding decline
Orange 625 2,667 18 82 22.3% 30.7% 15.2 2.7 512 114
56
Anaheim · Public  Weak at the gate
Orange 363 1,393 18 87 20.9% 22.7% 14.6 2.8 315 66
57
Fountain Valley · Public  Compounding decline
Orange 375 1,430 17 71 24.1% 26.6% 15.2 3.2 266 64
58
Tustin · Public  Compounding decline
Orange 458 1,627 16 69 23.5% 28.4% 13.3 1.3 315 74
59
Buena Park · Public  Both ends slipping
Orange 424 1,682 16 61 26.5% 13.2% 14.9 3.3 257 68
60
Mission Viejo · Public  Material decline
Orange 394 1,566 15 88 17.3% 23.3% 11.7 2.5 347 60
61
Santa Ana · Public  Strong demand
Orange 337 1,451 15 61 25.0% 21.6% 12.8 1.8 204 51
62
· Public  Demand hides churn
Orange 454 1,908 15 53 27.9% 20.9% 12.8 2.0 240 67
63
Costa Mesa · Public  Tracking
Orange 304 1,730 14 64 22.6% 27.3% 12.5 1.3 195 44
64
La Habra · Public  Material decline
Orange 459 1,779 14 76 18.6% 16.9% 10.7 2.2 349 65
65
Santa Ana · Public  Demand hides churn
Orange 616 2,505 13 64 20.9% 24.1% 12.0 3.1 397 83
66
Anaheim · Public  Compounding decline
Orange 379 1,539 13 54 24.8% 27.4% 11.9 2.1 206 51
67
La Palma · Public  Demand problem
Orange 527 1,983 13 88 15.0% 25.7% 11.2 1.9 466 70
68
Costa Mesa · Public  Demand problem
Orange 264 976 13 54 23.9% 17.6% 11.7 142 34
69
Anaheim · Public  Compounding decline
Orange 331 1,446 13 47 26.9% 26.2% 11.2 1.8 156 42
70
Huntington Beach · Public  Material decline
Orange 298 1,154 12 63 19.6% 24.3% 10.1 2.4 189 37
71
Orange · Public  Demand problem
Orange 439 1,795 12 57 20.2% 35.3% 8.9 1.4 252 51
72
Anaheim · Public  Compounding decline
Orange 592 2,326 11 56 20.2% 23.9% 10.1 1.0 331 67
73
Anaheim · Public  Compounding decline
Orange 389 1,466 11 51 21.0% 16.7% 10.0 1.3 200 42
74
Lake Forest · Public  Material decline
Orange 469 1,902 10 88 11.8% 38.8% 8.7 1.3 415 49
75
La Habra · Public  Tracking
Orange 471 1,881 10 55 17.4% 7.4 1.7 258 45
76
Anaheim · Public  Both ends slipping
Orange 401 1,608 9 57 16.2% 13.5% 8.5 1.2 229 37
77
Santa Ana · Public  Demand hides churn
Orange 500 1,519 8 37 22.4% 17.1% 7.4 0.8 183 41
78
Orange · Public  Demand hides churn
Orange 438 1,728 7 33 19.9% 20.7% 5.9 0.7 146 29
UC Reach = top-6 UC admits ÷ senior class size. Where UCOP has not published unique-student totals, campus admits are summed — students admitted to more than one of the 6 campuses are counted at each, so values above 100 indicate strong students winning multiple competitive UC offers. Schools with fewer than 100 seniors are excluded from the leaderboard by default — a small cohort with one strong year can otherwise dominate. See methodology →