Balboa School
Escondido · San Diego County · Private independent
Compare with peers
Most similar nearby schools
High Bluff Academy → Fusion Academy → Cal Coast Academy → Torah High School of San Diego → Pacific Academy → Compare all similar →How Balboa School compares for families
What families should know about Balboa School.
- ▸ vs Similar SchoolsThe closest comparables nearby: High Bluff Academy, Fusion Academy, Cal Coast Academy and 2 more. See the sidebar to compare side-by-side.
For Parents
Get alerts when Balboa School's numbers change
New admissions results, enrollment shifts, test scores — a few alerts a year, no spam. Your email also saves your list across devices.
Objective, government-grade data — no school pays us for placement.
No SBAC data for private schools — and that's not the metric you want anyway
California's Smarter Balanced (CAASPP) assessment is administered by the state, by statute, to public & charter schools only. Private schools don't sit for it. That's why the SBAC card is missing on this profile — not a data gap on our side, a deliberate scope of the state's testing program.
For private schools, UC Reach is the stronger academic signal anyway. SBAC measures grade-11 inputs (proficiency on a state standard); UC Reach measures outputs (who actually got into the most selective UCs). For private-school families weighing tuition against college outcomes, the outputs are the relevant signal.
This school doesn't have UC outcomes data on file yet — we surface UCOP-published admits by sending HS, and not every private school appears in those records. The enrollment trend, stability, and other cards on this page are still primary-sourced for this school.
Enrollment trend & projection
How does Balboa School really compare on getting kids to college?
Unlock a head-to-head snapshot of Balboa School against its 10 most similar nearby schools — matched on size, location, type, and religious orientation. See exactly where it stands on the college pipeline.
Your similar-school group includes
High Bluff Academy · Fusion Academy · Cal Coast Academy · Torah High School of San Diego · Pacific Academy · Fusion Academy Newport Beach · +4 more
Financial profile — IRS Form 990, FY2017
From 5 years of Form 990 filings via ProPublica Nonprofit Explorer (free public IRS data). The school's tax filings show financial scale, fundraising health, and endowment trajectory — signals that drive board-level conversations about tuition pricing, financial-aid capacity, and capital projects.
Source: IRS Form 990 via ProPublica Nonprofit Explorer (EIN 202684204). Tuition-per-student is total program-service revenue divided by latest enrollment — a rough average that includes auxiliary revenue (athletics, food service, etc.); the actual published tuition can differ. Form 990 is filed annually under penalty of perjury, so the financial scale figures are authoritative.
Private-school figures come from the California Private School Affidavit. Per CDE, inclusion in private-school data is not an evaluation, approval, or endorsement of a school.
Campus Breakdown — 2022
| Campus | Applicants | Admits | Enrollees | Admit Rate | UC Reach Score | Yield | Avg GPA (App) | Avg GPA (Adm) |
|---|---|---|---|---|---|---|---|---|
| UC San Diego → Selective | 5 | —† | —† | —† | —† | — | 3.57 | —† |
What This Means
Related reading
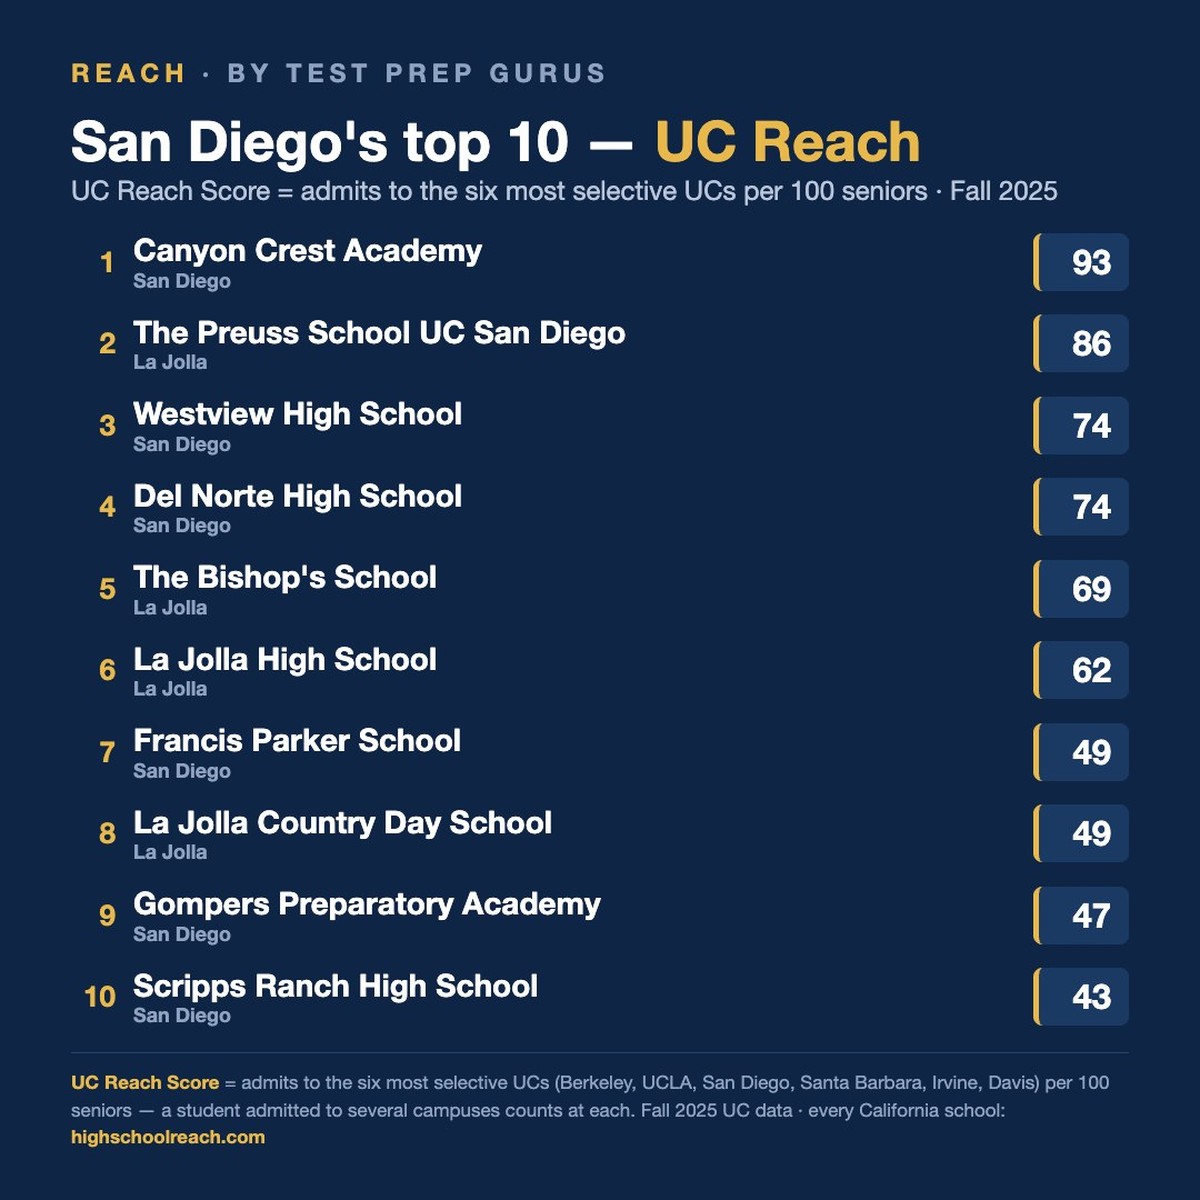
San Diego · League table · August 9, 2026

UC testing review · August 25, 2026