County Sort table by Diagnosis Type Year

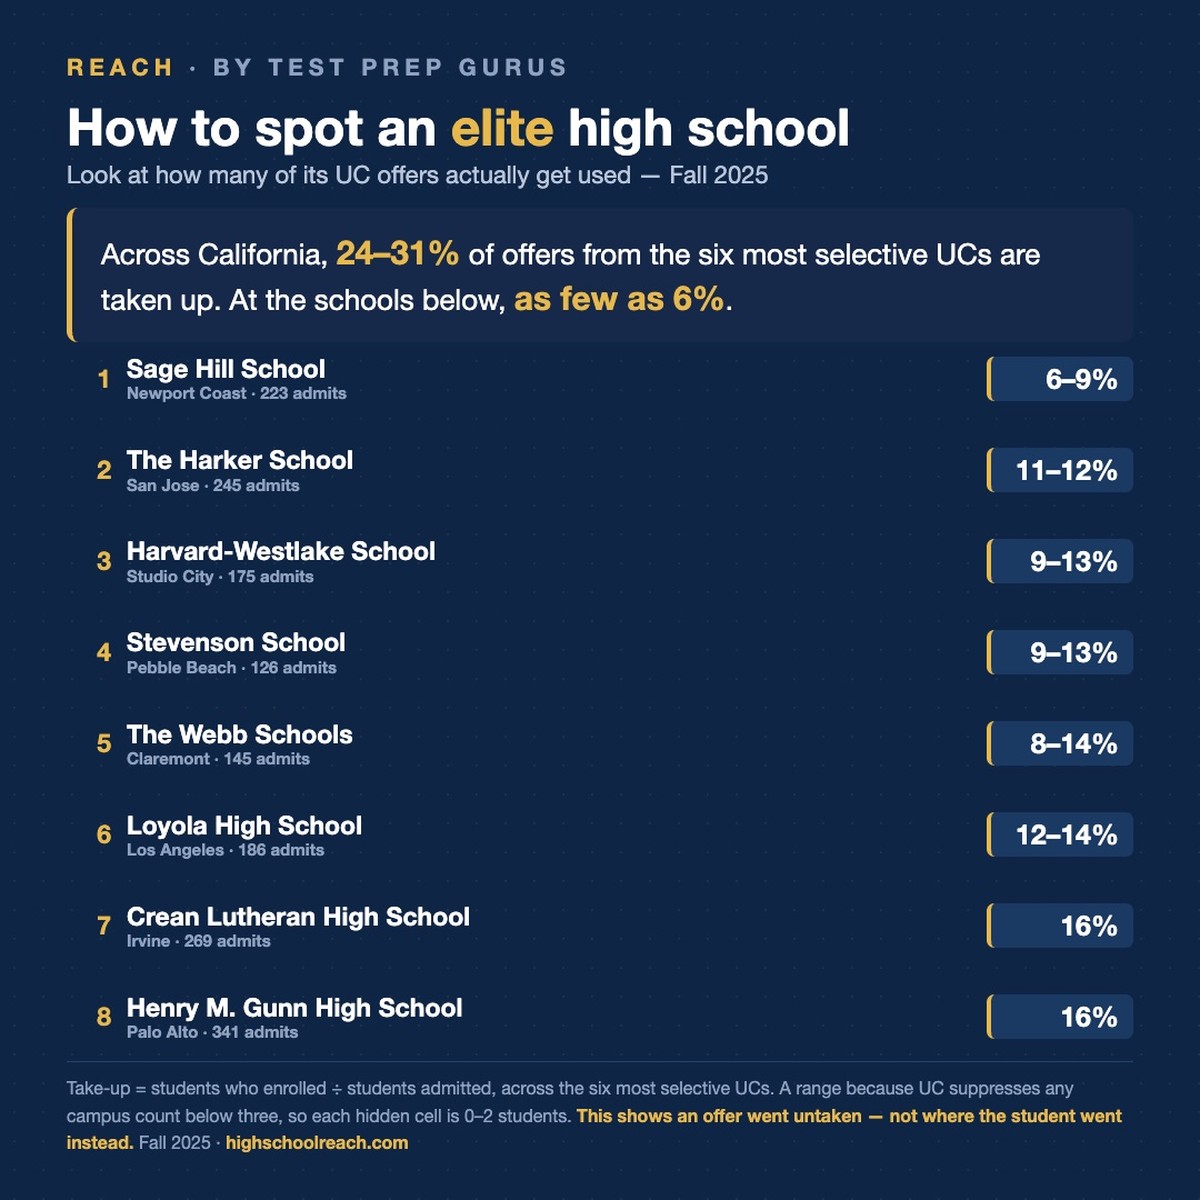
Top 10 in California — UC Reach Score

California · 2025 · ≥50 seniors
What is UC Reach? UC Reach = top-6 UC admits ÷ senior class size, summing each campus — measured against a school's entire graduating class, across the six most selective UCs (Berkeley, UCLA, San Diego, Santa Barbara, Irvine, Davis). It's a better gauge of school-wide success than admit rate, which only reflects the handful of students who applied.
Why it beats admit rate: if 6 students apply to the top UCs and all get in, that's a 100% admit rate — but at a 1,000-senior school it's a UC Reach Score of just 0.6 (6 ÷ 1,000). By contrast, a school where 250 of 1,000 seniors land a top-UC admit has a UC Reach Score of 25 — far stronger, even though its admit rate is lower.
Why some schools are over 100? Out of every 100 seniors at these schools, the class is generating more than 100 admissions to the six most selective UCs — meaning the typical strong student is getting in at multiple top campuses (UCLA + UCSD, or Berkeley + UCSB + Irvine, for example). It's a rare achievement: fewer than 1% of California high schools clear a UC Reach Score of 100.

This board needs a class of 100+ seniors. Schools smaller than that are ranked on the small-schools board below — which is where California's highest UC Reach Score actually sits.

Small schools — California · 2025

Ranked separately because they graduate 25–99 seniors — magnet programs, specialized charters and small privates. A class of 60 swings far more year to year than a class of 600, so mixing them into the boards above would compare unlike things. The state's single highest UC Reach Score sits on this board, not the one above it.

▲ Top 10 Small Public + Charter

California

1
North Hollywood · Public
109
2
Stockton · Public
109
3
Santa Ana · Public
100
4
Los Angeles · Public
98
5
Santa Cruz · Public
94
6
Los Angeles · Public
90
7
Fresno · Public
87
8
Tustin · Public
87
9
Los Angeles · Public
82
10
San Bernardino · Public
81

▲ Top 10 Small Private

California

1
Fremont · Private
212
2
San Jose · Private
194
3
Irvine · Private
161
4
Los Angeles · Private
121
5
Palo Alto · Private
114
6
Dublin · Private
113
7
Pasadena · Private
104
8
Sacramento · Private
93
9
Inglewood · Private
86
10
Alameda · Private
83

Leaderboards by type — California (2025)

Top and bottom schools by UC Reach, split public/charter vs private (≥50 seniors). Pick a County above to rank within it.

▲ Top 10 Public + Charter

California

1
Carson · Public
129
2
Cerritos · Public
126
3
Santa Ana · Charter
96
4
Fresno · Public
95
5
San Diego · Public
93
6
La Jolla · Public
86
7
San Jose · Public
86
8
Wilmington · Public
86
9
Cupertino · Public
85
10
Cypress · Public
84

▲ Top 10 Private

California

1
Newport Coast · Private
151
2
Claremont · Private
144
3
San Jose · Private
126
4
La Canada · Private
103
5
Anaheim · Private
101
6
San Jose · Private
96
7
Pebble Beach · Private
95
8
Irvine · Private
94
9
San Jose · Private
94
10
Oakland · Private
81

▼ Bottom 10 Public + Charter

California

1
Los Angeles · Public
1
2
Oceanside · Public
1
3
Fontana · Public
1
4
San Diego · Public
2
5
Waterford · Public
2
6
Mckinleyville · Public
3
7
Nicolaus · Public
3
8
Menifee · Public
3
9
Colusa · Public
3
10
Gridley · Public
3

▼ Bottom 10 Private

California

1
El Cajon · Private
2
2
Redlands · Private
6
3
Ontario · Private
10
4
Long Beach · Private
13
5
Mission Hills · Private
13
6
Los Angeles · Private
14
7
San Diego · Private
14
8
Modesto · Private
14
9
Cerritos · Private
16
10
Santa Maria · Private
17

Top 10 by individual UC campus — California · 2025

Where each UC campus lands its admits, as a share of each high school's senior class. Same 50-senior floor.

Top 10 — UCB Reach

UC Berkeley

1
Claremont · Private
17
2
San Mateo · Private
17
3
La Canada · Private
16
4
Calabasas · Private
15
5
Carson · Public
14
6
Newport Coast · Private
14
7
San Francisco · Private
14
8
San Jose · Private
13
9
Cerritos · Public
13
10
San Francisco · Public
13

Top 10 — UCLA Reach

UCLA

1
Los Angeles · Public
12
2
Carson · Public
12
3
Newport Coast · Private
12
4
San Jose · Private
11
5
Los Angeles · Private
10
6
Santa Ana · Charter
10
7
San Francisco · Private
9
8
La Canada · Private
9
9
Compton · Public
9
10
Claremont · Private
9

Top 10 — UCSD Reach

UC San Diego

1
La Jolla · Public
39
2
Carson · Public
34
3
Claremont · Private
25
4
Victorville · Public
20
5
Los Angeles · Public
19
6
Cerritos · Public
19
7
San Jose · Private
18
8
Los Angeles · Public
18
9
Redwood City · Public
18
10
Newport Coast · Private
18

Top 10 — UCSB Reach

UC Santa Barbara

1
Newport Coast · Private
43
2
San Jose · Private
41
3
San Jose · Private
30
4
Claremont · Private
30
5
La Canada · Private
29
6
San Jose · Public
29
7
San Diego · Public
28
8
Cerritos · Public
28
9
Cupertino · Public
28
10
San Jose · Private
28

Top 10 — UCI Reach

UC Irvine

1
Newport Coast · Private
39
2
Cerritos · Public
37
3
Carson · Public
34
4
Claremont · Private
30
5
San Diego · Public
30
6
San Diego · Public
27
7
Fresno · Public
27
8
Cypress · Public
26
9
Irvine · Private
26
10
Santa Ana · Charter
23

Top 10 — UCD Reach

UC Davis

1
Claremont · Private
34
2
Sacramento · Public
31
3
Wilmington · Public
28
4
Pebble Beach · Private
27
5
Newport Coast · Private
25
6
San Francisco · Public
24
7
Fresno · Public
24
8
Daly City · Public
24
9
San Lorenzo · Public
23
10
Los Angeles · Public
23

Beyond UC Reach — more lenses on California

UC Reach measures who gets in. These lenses measure the upstream pipeline (A-G), the downstream outcome (UC graduation), the capacity that drives the pipeline (counselors), reliability over time (consistency), grade-11 academic preparation (CAASPP SBAC ELA & Math), and private-school financial strength. Click any school for its full profile.

Top 10 — A-G Completion

% of graduates meeting UC/CSU course requirements · 2024-25 cohort

1
Carson · Public
100.0%
2
San Lorenzo · Public
100.0%
3
San Diego · Public
100.0%
4
Los Angeles · Public
100.0%
5
Los Angeles · Public
100.0%
6
Richmond · Public
100.0%
7
Sacramento · Public
100.0%
8
Huntington Park · Public
100.0%
9
San Diego · Public
100.0%
10
Los Angeles · Public
100.0%

Top 10 — UC 6-Yr Grad Rate

% of UC entrants who finished in 6 years · cohort N ≥ 20

1
Atherton · Public
100.0%
2
Mountain House · Public
100.0%
3
Lafayette · Public
100.0%
4
Santa Clarita · Public
100.0%
5
Antelope · Public
100.0%
6
Santa Rosa · Public
100.0%
7
Los Angeles · Public
100.0%
8
Sacramento · Public
100.0%
9
Sebastopol · Public
100.0%
10
Pasadena · Private
100.0%

Top 10 — Best Counselor Capacity

Lowest students-per-counselor (ASCA target 250:1) · public/charter, ≥500 students

1
Los Angeles · Public
100:1
2
La Puente · Public
107:1
3
Daly City · Public
123:1
4
Arleta · Public
125:1
5
Los Angeles · Public
129:1
6
Pacifica · Public
131:1
7
City Of Industry · Public
134:1
8
Los Angeles · Public
137:1
9
Beverly Hills · Public
138:1
10
Fresno · Public
144:1

Top 10 — Most Consistent

Lowest UC Reach std-dev across 5 years (above-CA-median mean)

1
avg 19.7 · σ 0.87
σ 0.87
2
avg 30.5 · σ 1.08
σ 1.08
3
avg 19.9 · σ 1.77
σ 1.77
4
avg 53.9 · σ 1.8
σ 1.8
5
avg 40.6 · σ 1.82
σ 1.82
6
avg 25.2 · σ 1.93
σ 1.93
7
avg 19.0 · σ 2.16
σ 2.16
8
avg 28.8 · σ 2.31
σ 2.31
9
avg 23.8 · σ 2.31
σ 2.31
10
avg 44.8 · σ 2.34
σ 2.34

Top 10 — SBAC ELA met/exceeded

% Met or Exceeded Standard · Grade 11 CAASPP · public/charter · tested ≥30

1
Cerritos · n=170 · 2025
100%
2
Riverside · n=57 · 2025
100%
3
Grass Valley · n=36 · 2025
100%
4
Carson · n=157 · 2025
99%
5
Stockton · n=79 · 2025
99%
6
Gilroy · n=72 · 2025
99%
7
Cypress · n=185 · 2025
98%
8
Wilmington · n=108 · 2025
98%
9
Fresno · n=121 · 2025
98%
10
Los Angeles · n=36 · 2025
97%

Top 10 — SBAC Math met/exceeded

% Met or Exceeded Standard · Grade 11 CAASPP · public/charter · tested ≥30

1
Riverside · n=57 · 2025
100%
2
Cerritos · n=170 · 2025
99%
3
Los Angeles · n=36 · 2025
97%
4
Cypress · n=185 · 2025
95%
5
Carson · n=157 · 2025
95%
6
North Hollywood · n=58 · 2025
95%
7
San Jose · n=411 · 2025
93%
8
Grass Valley · n=36 · 2025
89%
9
Fremont · n=420 · 2025
89%
10
San Diego · n=559 · 2025
86%

Top 10 — Private Net Assets

Wealthiest CA private high schools · IRS Form 990 · latest fiscal year

1
Studio City · Nonsectarian · FY 2024
$656.3M
2
San Jose · Nonsectarian · FY 2024
$290.3M
3
Atherton · Nonsectarian · FY 2023
$243.0M
4
Carpinteria · Nonsectarian · FY 2023
$193.0M
5
Pasadena · Nonsectarian · FY 2023
$167.8M
6
Santa Monica · Nonsectarian · FY 2023
$152.2M
7
Palo Alto · Nonsectarian · FY 2023
$146.9M
8
Los Angeles · Nonsectarian · FY 2023
$142.4M
9
Santa Rosa · FY 2023
$114.8M
10
San Francisco · Nonsectarian · FY 2023
$110.3M

Reach momentum — biggest gains & declines over time

≥50 seniors · earliest→latest year

Which schools are moving a growing — or shrinking — share of their graduating class into the six most selective UCs. Reflects the current county/type filter.

▲ Biggest gains

SchoolThen → NowΔ
Claremont · Private
63 '21 → 144 '25 +80.6pp
Sacramento · Public
27 '18 → 82 '25 +55.1pp
Mountain House · Public
12 '18 → 62 '25 +49.3pp
Los Angeles · Public
3 '20 → 46 '25 +42.9pp
Cerritos · Public
86 '18 → 126 '25 +40.2pp
Redwood City · Public
32 '18 → 70 '25 +37.5pp
San Francisco · Public
34 '18 → 70 '25 +36.4pp
San Francisco · Public
25 '18 → 61 '25 +35.6pp
Los Angeles · Public
30 '18 → 65 '25 +34.7pp
San Francisco · Private
24 '20 → 59 '25 +34.5pp

▼ Biggest declines

SchoolThen → NowΔ
Lancaster · Public
106 '21 → 56 '25 -50.1pp
San Jose · Public
122 '18 → 86 '25 -36.4pp
Fremont · Public
102 '18 → 70 '25 -31.8pp
San Jose · Private
73 '20 → 43 '25 -30.2pp
Chula Vista · Public
65 '18 → 36 '25 -29.0pp
Cypress · Public
110 '18 → 84 '25 -26.3pp
Richmond · Public
63 '21 → 38 '25 -25.1pp
Perris · Public
34 '18 → 10 '25 -24.1pp
Carlsbad · Private
62 '20 → 38 '25 -24.0pp
San Francisco · Private
79 '20 → 55 '25 -23.3pp

Demand momentum — biggest gaps vs the county baseline

grade-12 enrollment Δ vs. county · ≥80 students

The demographic tide is shrinking CA enrollment ~10% over 7 years statewide, so absolute decline alone is noise. The gap vs the county baseline is the actionable signal — schools losing share faster than their demographic floor are the ones to watch. Reflects the current county/type filter.

▲ Outperforming the county the most

SchoolSchool · CountyGap
Duarte · Los Angeles · Public  Best in class
+172.2% vs -4.7% +176.9pp
El Segundo · Los Angeles · Public  Strong demand
+160.8% vs -8.5% +169.3pp
San Diego · San Diego · Public  Demand hides churn
+147.1% vs -6.9% +154.0pp
San Jacinto · Riverside · Public  Best in class
+118.9% vs -2.6% +121.5pp
Mountain House · San Joaquin · Public  Best in class
+135.6% vs +19.8% +115.8pp
San Jose · Santa Clara · Public  Watch — engagement
+129.6% vs +17.0% +112.6pp
Stockton · San Joaquin · Public  Best in class
+129.2% vs +19.8% +109.4pp
Los Angeles · Los Angeles · Public  Best in class
+89.7% vs -5.3% +94.9pp
Compton · Los Angeles · Public  Best in class
+84.6% vs -4.7% +89.3pp
Los Angeles · Los Angeles · Public  Watch — engagement
+83.1% vs -5.3% +88.4pp

▼ Underperforming the county the most

SchoolSchool · CountyGap
Waterford · Stanislaus · Public  Compounding decline
-65.7% vs +2.3% -67.9pp
Paradise · Butte · Public  Material decline
-46.3% vs +19.8% -66.1pp
Fresno · Fresno · Public  Compounding decline
-53.4% vs +6.7% -60.0pp
Oakland · Alameda · Public  Sharp downturn
-52.4% vs +2.5% -54.9pp
Lincoln · Placer · Public  Material decline
-33.5% vs +16.4% -49.9pp
Pomona · Los Angeles · Public  Compounding decline
-55.0% vs -5.3% -49.8pp
Roseville · Placer · Public  Compounding decline
-29.9% vs +16.4% -46.2pp
Mckinleyville · Humboldt · Public  Material decline
-4.3% vs +41.0% -45.3pp
Venice · Los Angeles · Public  Sharp downturn
-50.3% vs -5.3% -45.1pp
Oakhurst · Madera · Public  Compounding decline
-36.7% vs +6.9% -43.6pp

GPA Performance — over/under their predicted UC admit rate

996 schools eligible · 2025

Each dot is one school. The diagonal is the per-campus GPA expectation — points above it admit students at higher rates than their GPA mix predicts; points below admit at lower rates. Schools need ≥30 top-6 UC applications and data across ≥3 campuses to appear.

▲ Top 10 outperformers

School GPA Actual Δ vs exp.
West Covina · Private
3.95 68.8% +41.8pp
Oroville · Public
4.08 64.5% +38.6pp
Palo Cedro · Public
4.01 62.9% +33.6pp
Farmersville · Public
3.92 59.5% +33.4pp
Reedley · Public
4.10 59.0% +33.1pp
Olivehurst · Public
3.96 51.4% +30.8pp
Avenal · Public
3.85 53.4% +30.0pp
Oakdale · Public
4.00 57.6% +29.5pp
Caruthers · Public
3.86 56.1% +28.5pp
Stockton · Public
3.91 56.8% +28.5pp

▼ Top 10 underperformers

School GPA Actual Δ vs exp.
Inglewood · Public
3.24 25.0% -16.8pp
Los Angeles · Public
3.36 21.1% -15.2pp
Los Angeles · Public
3.38 21.1% -14.5pp
North Hollywood · Public
3.46 13.5% -13.3pp
Perris · Public
3.57 17.6% -9.2pp
Pacifica · Public
3.90 19.6% -8.7pp
Panorama City · Public
3.48 17.1% -8.6pp
Bloomington · Public
3.48 20.4% -8.6pp
Hercules · Public
3.86 15.9% -8.0pp
Lake Forest · Public
3.85 13.5% -8.0pp

Full rankings — every California high school by UC Reach Score

Sortable by any column. Click a column header to sort. Click any school row to open its profile.

1,561 schools · 2025 data · Page 14 of 16 (showing 1301–1400)
Apply 50-senior floor Compare selected schools →
# School County Seniors Total Enroll UC Reach Score App Reach Score Admit Rate Yield Selective Reach Elite Reach Raw Apps Raw Admits
1301
Foresthill · Public  Compounding decline
Placer 42 190 7 45 15.8% 19 3
1302
Olivehurst · Public  Compounding decline
Yuba 252 1,254 7 20 36.0% 33.3% 4.0 1.2 50 18
1303
Orange Cove · Public  Sharp downturn
Fresno 155 635 7 18 39.3% 4.5 1.9 28 11
1304
Blythe · Public  Weak at the gate
Riverside 155 740 7 19 37.9% 4.5 29 11
1305
Los Angeles · Public  Demand hides churn
Los Angeles 127 493 7 119 6.0% 7.1 151 9
1306
Fallbrook · Public  Tracking
San Diego 440 1,853 7 37 19.2% 29.0% 6.1 161 31
1307
King City · Public  Strong demand
Monterey 284 1,199 7 31 22.7% 15.0% 3.5 1.1 88 20
1308
Coalinga · Public  Watch — engagement
Fresno 299 1,256 7 33 21.4% 4.3 98 21
1309
Waterford · Public  Compounding decline
Stanislaus 57 776 7 104 6.8% 75.0% 59 4
1310
East Palo Alto · Public  Compounding decline
San Mateo 57 194 7 125 5.6% 71 4
1311
Middletown · Public  Sharp downturn
Lake 86 421 7 34 20.7% 3.5 29 6
1312
San Jose · Public  Demand problem
Santa Clara 72 261 7 28 25.0% 20 5
1313
Cloverdale · Public  Material decline
Sonoma 87 393 7 54 12.8% 47 6
1314
Vallejo · Public  Watch — engagement
Solano 58 186 7 107 6.5% 62 4
1315
Jackson · Public  Demand problem
Amador 132 593 7 33 20.4% 2.3 44 9
1316
Elk Grove · Public  Sharp downturn
Sacramento 443 1,684 7 50 13.4% 26.7% 4.5 0.7 223 30
1317
Shafter · Public  Best in class
Kern 326 1,599 7 27 25.3% 4.9 87 22
1318
Pomona · Public  Sharp downturn
Los Angeles 89 270 7 66 10.2% 50.0% 6.7 3.4 59 6
1319
Stockton · Public  Compounding decline
San Joaquin 478 2,065 7 25 26.7% 34.4% 4.2 0.8 120 32
1320
Citrus Heights · Public  Demand problem
Sacramento 225 894 7 28 23.8% 26.7% 1.8 63 15
1321
Orange · Public  Demand hides churn
Orange 438 1,728 7 33 19.9% 20.7% 5.9 0.7 146 29
1322
Moreno Valley · Public  Demand hides churn
Riverside 471 1,924 7 43 15.2% 6.6 0.6 204 31
1323
Yreka · Public  Demand hides churn
Siskiyou 153 612 7 30 21.7% 3.9 46 10
1324
Sacramento · Public  Watch — engagement
Sacramento 46 464 7 67 9.7% 31 3
1325
North Hills · Private
Los Angeles 92 745 7 100 6.5% 3.3 92 6
1326
Riverdale · Public  Sharp downturn
Fresno 125 496 6 33 19.5% 3.2 41 8
1327
San Diego · Private
San Diego 47 196 6 179 3.6% 84 3
1328
Citrus Heights · Public  Compounding decline
Sacramento 141 559 6 40 15.8% 2.1 57 9
1329
La Habra · Private
Orange 94 410 6 67 9.5% 6.4 63 6
1330
Sacramento · Private
Sacramento 63 660 6 87 7.3% 75.0% 55 4
1331
Mount Shasta · Public  Material decline
Siskiyou 63 241 6 16 40.0% 6.3 10 4
1332
Banning · Public  Demand hides churn
Riverside 268 1,145 6 30 21.2% 23.5% 6.3 80 17
1333
Fortuna · Public  Compounding decline
Humboldt 177 826 6 29 21.6% 27.3% 3.4 51 11
1334
Oakland · Public  Watch — engagement
Alameda 49 723 6 135 4.5% 66 3
1335
Fresno · Public  Sharp downturn
Fresno 131 625 6 22 27.6% 3.0 29 8
1336
Yucaipa · Public
San Bernardino 641 2,755 6 23 26.0% 25.6% 5.0 150 39
1337
Fairfield · Public  Material decline
Solano 448 1,844 6 31 19.7% 25.9% 3.1 0.9 137 27
1338
Visalia · Public  Strong demand
Tulare 455 2,059 6 27 21.8% 29.6% 4.0 124 27
1339
Los Angeles · Public  Compounding decline
Los Angeles 68 239 6 84 7.0% 57 4
1340
Sutter Creek · Public  Strong demand
Amador 153 615 6 46 12.9% 2.6 70 9
1341
Marysville · Public  Demand problem
Yuba 240 1,034 6 21 27.4% 21.4% 2.9 51 14
1342
Hemet · Public  Demand hides churn
Riverside 446 1,857 6 43 13.6% 15.4% 5.2 191 26
1343
Oakland · Public  Demand hides churn
Alameda 191 719 6 36 15.9% 3.1 69 11
1344
Big Bear Lake · Public  Sharp downturn
San Bernardino 140 630 6 38 15.1% 5.7 53 8
1345
Redlands · Private
San Bernardino 106 1,232 6 60 9.4% 5.7 64 6
1346
Galt · Public  Sharp downturn
Sacramento 213 899 6 25 22.2% 3.8 54 12
1347
Bakersfield · Public  Demand hides churn
Kern 747 3,069 6 19 29.0% 9.5% 4.3 145 42
1348
Live Oak · Public  Strong demand
Sutter 143 603 6 36 15.4% 50.0% 52 8
1349
Twentynine Palms · Public  Watch — engagement
San Bernardino 143 719 6 36 15.7% 5.6 51 8
1350
Durham · Public  Best in class
Butte 72 320 6 24 23.5% 17 4
1351
Kelseyville · Public  Weak at the gate
Lake 145 515 6 28 20.0% 2.1 40 8
1352
Oakland · Public  Demand hides churn
Alameda 91 676 5 71 7.7% 65 5
1353
Gustine · Public  Sharp downturn
Merced 128 531 5 31 17.5% 3.1 40 7
1354
Atwater · Public  Material decline
Merced 421 1,704 5 34 16.1% 26.1% 3.3 143 23
1355
Bakersfield · Public  Demand hides churn
Kern 498 2,135 5 22 24.1% 4.4 112 27
1356
Oakland · Public  Compounding decline
Alameda 74 273 5 78 6.9% 58 4
1357
Concord · Public  Demand hides churn
Contra Costa 334 1,397 5 31 17.6% 33.3% 3.3 102 18
1358
San Diego · Public  Best in class
San Diego 56 247 5 102 5.3% 5.4 57 3
1359
Taft · Public  Tracking
Kern 262 1,064 5 18 29.8% 3.4 47 14
1360
Tranquillity · Public  Weak at the gate
Fresno 94 370 5 72 7.3% 68 5
1361
Antioch · Public  Compounding decline
Contra Costa 417 1,812 5 33 16.1% 27.3% 3.4 0.7 137 22
1362
Hayward · Public  Mid-year churn
Alameda 419 1,511 5 21 25.3% 13.6% 3.6 0.7 87 22
1363
Santa Rosa · Public  Compounding decline
Sonoma 230 1,029 5 22 23.5% 2.2 51 12
1364
Stockton · Public  Both ends slipping
San Joaquin 405 1,677 5 15 35.6% 2.7 59 21
1365
El Cerrito · Public  Best in class
Contra Costa 78 554 5 117 4.4% 91 4
1366
Fresno · Public  Demand hides churn
Fresno 412 2,040 5 32 16.0% 14.3% 3.9 1.0 131 21
1367
Hamilton City · Public  Strong demand
Glenn 59 306 5 36 14.3% 21 3
1368
Bakersfield · Public  Demand problem
Kern 516 2,043 5 21 24.3% 3.9 107 26
1369
Nevada City · Public  Compounding decline
Nevada 80 294 5 19 26.7% 5.0 15 4
1370
Oroville · Public  Compounding decline
Butte 242 872 5 19 26.1% 58.3% 2.5 46 12
1371
Fairfield · Public  Demand hides churn
Solano 387 1,605 5 24 20.6% 36.8% 2.6 92 19
1372
Redding · Public  Best in class
Shasta 270 1,148 5 34 14.0% 53.9% 2.2 93 13
1373
Antioch · Public  Mid-year churn
Contra Costa 399 1,776 5 33 14.5% 2.8 0.8 131 19
1374
San Diego · Public  Compounding decline
San Diego 63 226 5 60 7.9% 4.8 38 3
1375
Ridgecrest · Public  Weak at the gate
Kern 345 1,536 5 23 20.0% 31.2% 3.2 80 16
1376
Thermal · Public  Demand hides churn
Riverside 65 503 5 83 5.6% 4.6 54 3
1377
Grass Valley · Public  Best in class
Nevada 152 664 5 39 11.9% 2.6 59 7
1378
Grass Valley · Public  Best in class
Nevada 350 1,561 5 32 14.4% 3.1 111 16
1379
San Juan Bautista · Public  Material decline
San Benito 66 267 5 9 50.0% 6 3
1380
Roseville · Public  Demand hides churn
Placer 66 1,668 5 8 60.0% 5 3
1381
Sacramento · Public  Best in class
Sacramento 67 542 4 27 16.7% 18 3
1382
East Palo Alto · Public  Demand problem
San Mateo 68 278 4 59 7.5% 4.4 40 3
1383
Temecula · Public  Mid-year churn
Riverside 207 987 4 22 19.6% 2.4 46 9
1384
Seaside · Public  Material decline
Monterey 278 1,073 4 22 20.0% 41.7% 1.4 60 12
1385
Sacramento · Public  Material decline
Sacramento 93 469 4 31 13.8% 29 4
1386
North Highlands · Public  Demand hides churn
Sacramento 186 778 4 16 26.7% 50.0% 30 8
1387
Rosamond · Public  Both ends slipping
Kern 187 927 4 27 16.0% 4.3 50 8
1388
Inglewood · Public  Compounding decline
Los Angeles 71 299 4 94 4.5% 4.2 67 3
1389
Loma Linda · Private
San Bernardino 96 1,261 4 62 6.7% 4.2 60 4
1390
Yucca Valley · Public  Sharp downturn
San Bernardino 268 1,168 4 17 23.9% 4.1 46 11
1391
Lakeport · Public  Material decline
Lake 74 335 4 32 12.5% 4.0 24 3
1392
Stockton · Public  Sharp downturn
San Joaquin 277 1,657 4 29 13.9% 27.3% 1.1 79 11
1393
Highland · Public  Compounding decline
San Bernardino 101 528 4 37 10.8% 4.0 37 4
1394
Lincoln · Public  Material decline
Placer 305 1,184 4 17 22.6% 25.0% 1.6 53 12
1395
Barstow · Public  Demand hides churn
San Bernardino 363 1,558 4 16 23.7% 2.5 59 14
1396
Eureka · Public  Material decline
Humboldt 286 1,162 4 24 16.2% 1.8 68 11
1397
Eureka · Public
Humboldt 286 1,162 4 24 16.2% 1.8 68 11
1398
Mariposa · Public  Material decline
Mariposa 83 461 4 28 13.0% 3.6 23 3
1399
Clarksburg · Public  Compounding decline
Yolo 198 291 4 8 46.7% 42.9% 15 7
1400
Denair · Public  Best in class
Stanislaus 87 306 3 16 21.4% 14 3
UC Reach = top-6 UC admits ÷ senior class size. Campus admits are SUMMED — UC publishes no per-school unique-student count, so a senior admitted to more than one of the 6 campuses is counted at each, and values above 100 indicate strong students winning multiple competitive UC offers. See methodology →

Related reading

The data Newsom asked for already exists — school by school

UC testing review · August 25, 2026

How to spot an elite high school in the data

Behind the data · August 24, 2026

All stories from the data →

What families ask next